

Welcome to salt, a tool to reverse and learn kernel heap memory management. It can be useful to develop an exploit, to debug your own kernel code, and, more importantly, to play with the kernel heap allocations and learn its inner workings.
This tool helps tracing allocations and the current state of the SLUB allocator in modern linux kernels.
It is written as a gdb plugin, and it allows you to trace and record memory allocations and to filter them by process name or by cache. The tool can also dump the list of active caches and print relevant information.
This repository also includes a playground loadable kernel module that can trigger allocations and deallocations at will, to serve both as a debugging tool and as a learning tool to better understand how the allocator works.
Also Read : Beef : The Browser Exploitation Framework Project
Here is the full list of commands:
salt help
Possible commands:
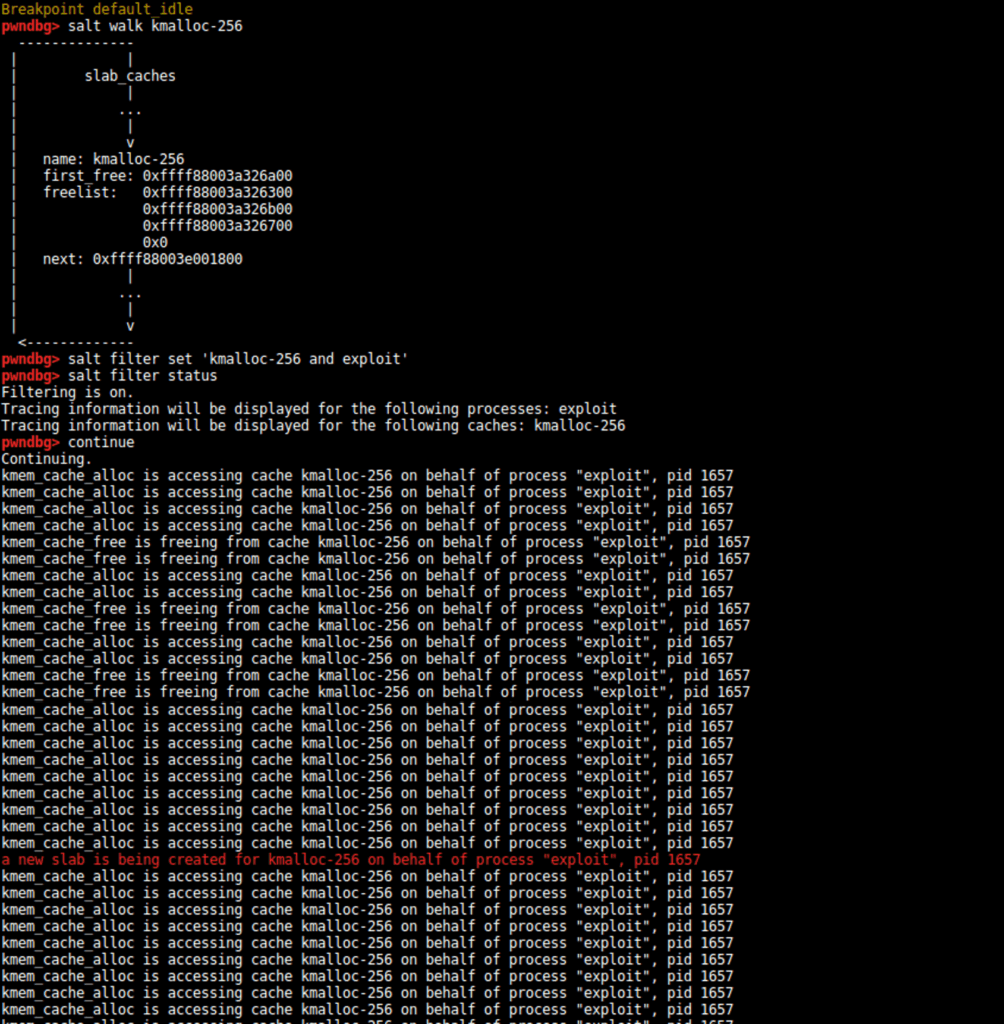
filter — manage filtering features by adding with one of the following arguments
enable — enable filtering. Only information about filtered processes will be displayed
disable — disable filtering. Information about all processes will be displayed.
status — display current filtering parameters
add process/cache — add one or more filtering conditions
remove process/cache — remove one or more filtering conditions
set — specify complex filtering rules. The supported syntax is “salt filter set (cache1 or cache2) and (process1 or process2)”.
Some variations might be accepted. Checking with “salt filter status” is recommended. For simpler rules use “salt filter add”.
record — manage recording features by adding with one of the following arguments
on — enable recording. Information about filtered processes will be added to the history
off — disable recording.
show — display the recorded history
clear — delete the recorded history
trace — reset all filters and configure filtering for a specific process
walk — navigate all active caches and print relevant information
walk_html — navigate all active caches and generate relevant information in html format
walk_json — navigate all active caches and generate relevant information in json format
help — display this message
And here you can see salt in action: