FalconEye is a windows endpoint detection software for real-time process injections. It is a kernel-mode driver that aims to catch process injections as they are happening (real-time). Since FalconEye runs in kernel mode, it provides a stronger and reliable defense against process injection techniques that try to evade various user-mode hooks.
You can check our presentation at 2021 Blackhat ASIA Arsenal and slides.
Project Overview
Detection Coverage
The table below shows the implementation status and the detection logic for the various process injection techniques. WPM stands for WriteProcessMemory. To test the detection, one can refer to the references section.
| Technique | Status | Detection | POC Used |
|---|---|---|---|
| Atombombing | ✓ | Hook QueueUserAPC and look for GlobalGetAtom family of functions | Pinjectra |
| Instrumentation callback injection | ✓ | Detect if a new thread is created from floating code | https://github.com/antonioCoco/Mapping-Injection |
| Reflective DLL Injection | ✓ | Detect if a new thread is created from floating code and if PE header is being written into victim | MInjector |
| PROPagate | ✓ | Hook SetProp to get the address of the property being written and corelate with the previous WPM calls to get the address of floating code | Pinjectra |
| Process Hollowing | ✓ | Detected using PE header written into target process memory | MInjector |
| CreateRemoteThread with LoadLibrary | ✓ | New thread with start address pointing to LoadLibrary. MInjector version also writes DLL path using WPM which is also detected | MInjector, Pinjectra |
| CreateRemoteThread with MapViewOfFile | ✓ | Detect if a new thread is created from floating code | Pinjectra |
| Suspend-Inject-Resume | ✓ | Detect if a new thread is created from floating code(MInjector). DLL Path being written via WPM (MInjector). Detect if context set on a previously suspended thread (Pinjectra) | MInjector, Pinjectra |
| QueueUserAPC | ✓ | DLL path being written via WPM | MInjector |
| QueueUserAPC with memset (Stackbombing) | ✓ | Hook QueueUserAPC and look for memset | Pinjectra |
| SetWindowLong (Extra window memory injection) | ✓ | Hook SetWindowLong to get the address of the function pointer being written and corelate with the previous WPM calls to get the address of floating code | Pinjectra |
| Unmap + Overwrite | ✓ | Alert if attacker process is unmapping ntdll from the victim | Pinjectra |
| Kernel Ctrl Table | ✓ | Detect if WPM is overwriting KernelCallbackTable field in the PEB of the victim | https://github.com/odzhan/injection/blob/master/kct |
| USERDATA | ✓ | Check if WPM target address is in conhost.exe range. If so check if any relevant function pointers from conhost match previously stored WPM address | https://github.com/odzhan/injection/blob/master/conhost |
| Ctrl-inject | ✓ | Detect if the attacker does WPM in victim’s KernelBase.dll range | Pinjectra |
| ALPC Callback | ✓ | Extract victim pid in NtConnectPort calls to ALPC port. For attacker-victim pid tuple check prior WPM calls and apply Floating code detection | Pinjectra |
| WNF Callback | ✓ | WPM followed by UpdateWNFStateData call | https://github.com/odzhan/injection/tree/master/wnf |
| SetWindowsHook | ✓ | Save module paths registered in NtUserSetWindowsHookEx hook. Later when a module matching this path loads in a different process, generate alert | MInjector |
| GhostWriting | ✓ | Detect if context is set (NtSetContextThread is called) on a previously suspended thread | Pinjectra |
| Service Control | ✓ | WPM overwriting Service IDE of a process (service) | https://github.com/odzhan/injection/tree/master/svcctrl |
| Shellcode injection | ✓ | New thread started from floating code. DLL path being written by WPM | MInjector |
| Image Mapping | ✓ | Thread started from floating code. PE header being written by WPM. DLL path being written by WPM | MInjector |
| Thread Reuse | ✓ | Thread started from floating code. DLL path being written by WPM | MInjector |
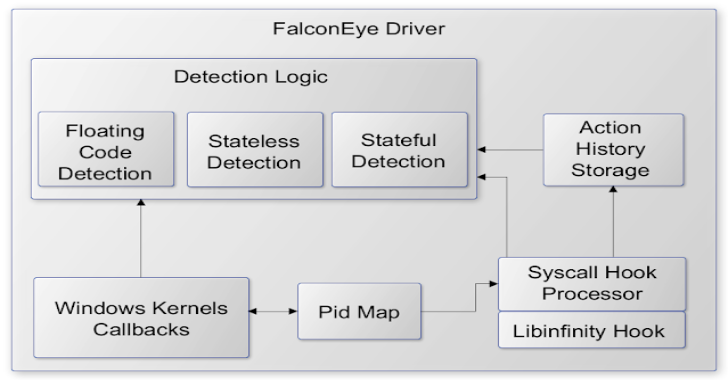
Architecture Overview

- The driver is an on-demand load driver
- The initialization includes setting up callbacks and syscall hooks via libinfinityhook
- The callbacks maintain a map of Pids built from cross process activity such as OpenProcess but it is not limited to OpenProcess
- Subsequent callbacks and syscall hooks use this Pid map to reduce the noise in processing. As a part of noise reduction, syscall hooks filter out same process activity.
- The detection logic is divided into subcategories namely – stateless (example: Atombombing), stateful (Unmap+Overwrite) and Floating code(Shellcode from multiple techniques)
- For stateful detections, syscall hooks record an ActionHistory which is implemented as a circular buffer. e.g. It records all the NtWriteVirtualMemory calls where the caller process is different from the target process.
- The detection logic has common anomaly detection functionality such as floating code detection and detection for shellcode triggers in remote processes. Both callbacks and syscall hooks invoke this common functionality for actual detection.
NOTE: Our focus has been detection and not creating a performant detection engine. We’ll continue on these efforts past the BlackHat presentation.
Files
.
├── src
│ ├── FalconEye —————————# FalconEye user and kernel space
│ └── libinfinityhook ———————# Kernel hook implementation
├── 2021BHASIA_FalconEye.pdf
└── README.md
Getting Started
Prerequisites
- Windows 10 Build 1903/1909
- Microsoft Visual Studio 2019 onwards
- Virtualization Software such as VmWare, Hyper-V (Optional)
Installation
Build
- Open the solution with Visual Studio 2019
- Select x64 as build platform
- Build solution. This should generate FalconEye.sys binary under src\kernel\FalconEye\x64\Debug or src\kernel\FalconEye\x64\Release
Test Machine Setup
- Install Windows 10 Build 1903/1909 in a VM
- Configure VM for testing unsigned driver
- Using bcdedit, disable integrity checks :
BCDEDIT /set nointegritychecks ON
- Run DbgView from sysinternals in the VM or start a debugging connection using WinDbg.
Usage
- Copy FalconEye.sys to the Test Machine (Windows 10 VM)
- Load FalconEye.sys as ‘On Demand’ load driver using OSR Loader or similar tools
- Run injection test tools such as pinjectra, minjector or other samples
- Monitor debug logs either via WinDbg or DbgView


