threat_note is a web application built by Defense Point Security to allow security researchers the ability to add and retrieve indicators related to their research. As of right now this includes the ability to add IP Addresses, Domains and Threat Actors, with more types being added in the future.
This app fills the gap between various solutions currently available, by being lightweight, easy-to-install, and by minimizing fluff and extraneous information that sometimes gets in the way of adding information. To create a new indicator, you only really need to supply the object itself (whether it be a Domain, IP or Threat Actor) and change the type accordingly, and boom! That’s it! Of course, supplying more information is definitely helpful, but, it’s not required.
Other applications built for storing indicators and research have some shortcomings that threat_note hopes to fix. Some common complaints with other apps are:
- Hard to install/configure/maintain
- Need to pay for added features (enterprise licenses)
- Too much information
- This boils down to there being so much stuff to do to create new indicators or trying to cram a ton of functions inside the app.
Installation
Now that we are using SQLite, there’s no need for a pesky Vagrant machine. All we need to do is install some requirements via pip and fire up the server:
cd threat_note
pip install -r requirements.txt
honcho start
Once the server is running, you can browse to http://localhost:5000 and register a new account to use to login into threat_note with.
Docker Installation
A development dockerfile is now available, to build it do the following from its directory:
sudo docker build -t threat_note .
sudo docker run -itd -p 8888:8888 threat_note
Once the server is running, you can browse to http://localhost:8888 and register a new account to use to login into threat_note with.
Screenshots
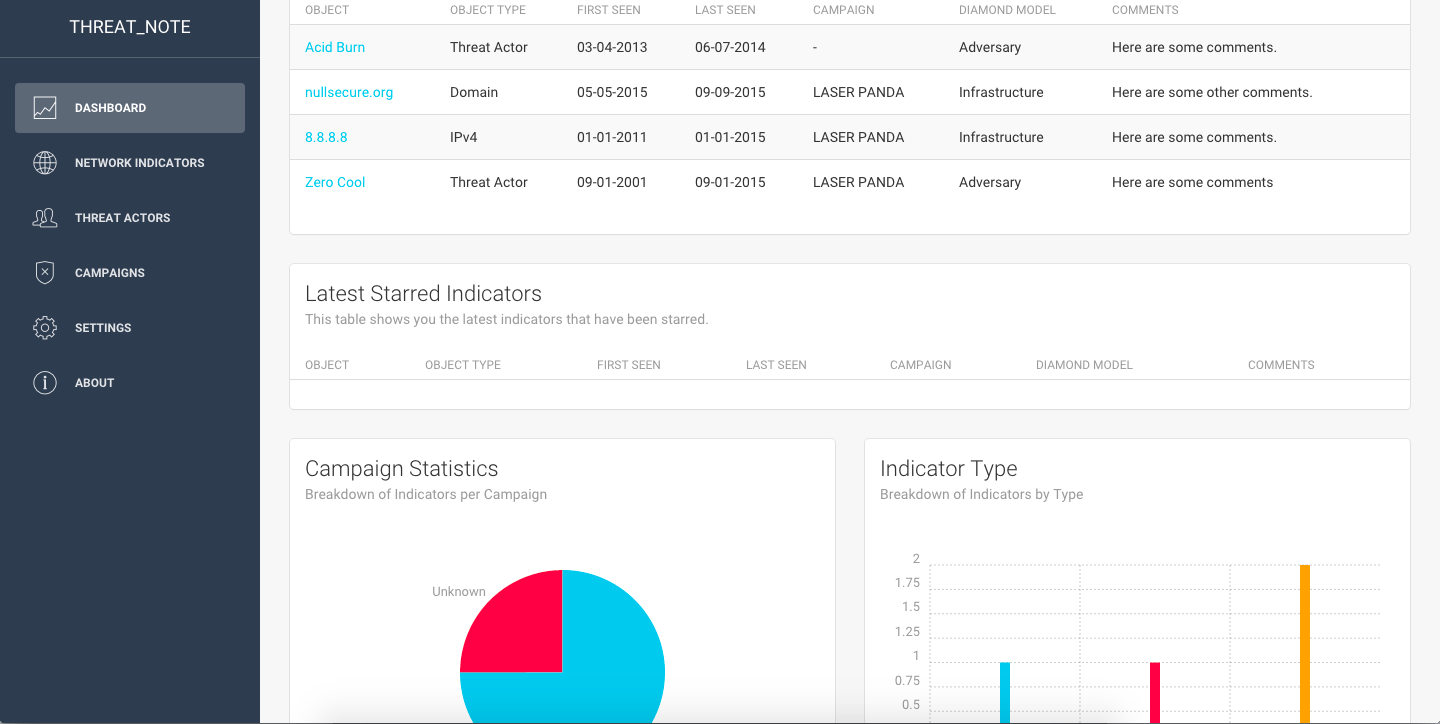
First up is a shot of the dashboard, which has the latest indicators, the latest starred indicators, and a campaign and indicator type breakdown.
Next is a screenshot of the Network Indicators page, here you will see all the indicators that have a type of “Domain”, “Network”, or “IP Address”.
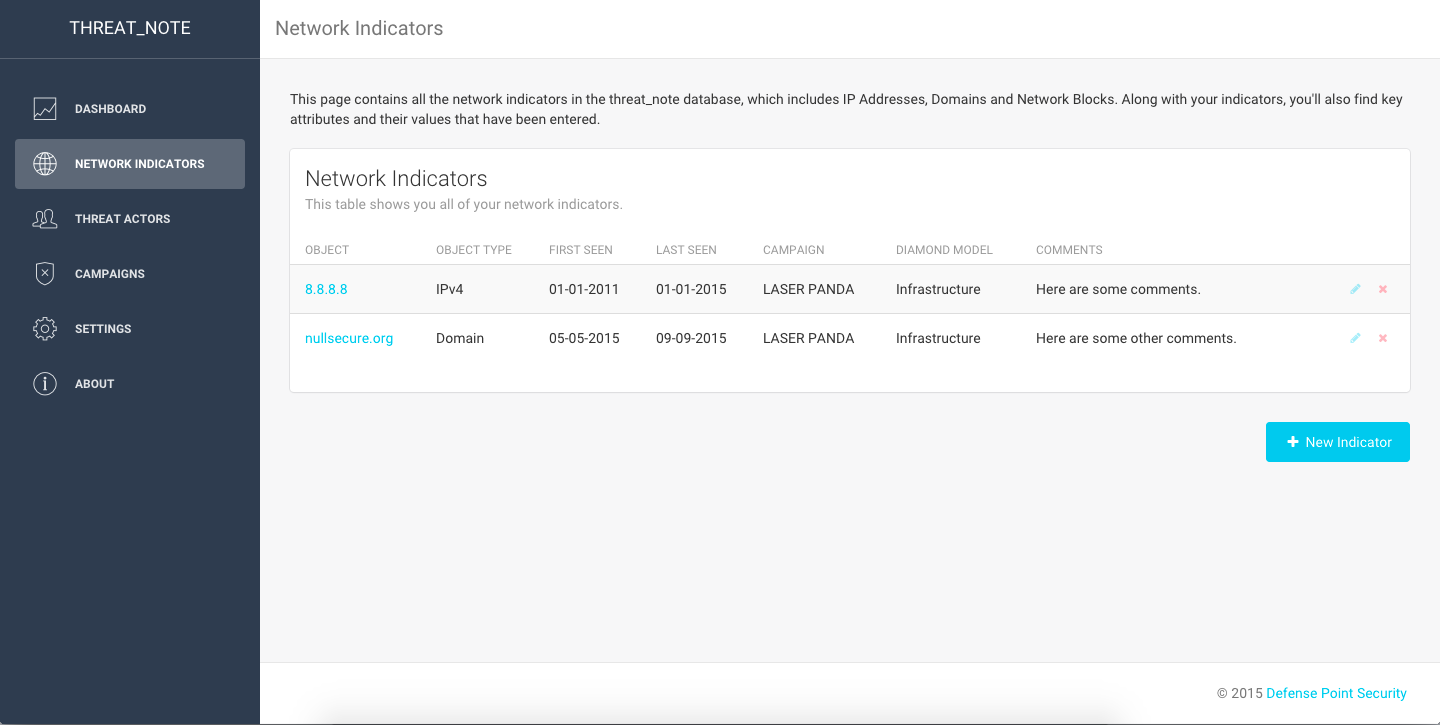
You can edit or remove the indicator right from this page, by hovering over the applicable icon on the right-hand side of the indicator.

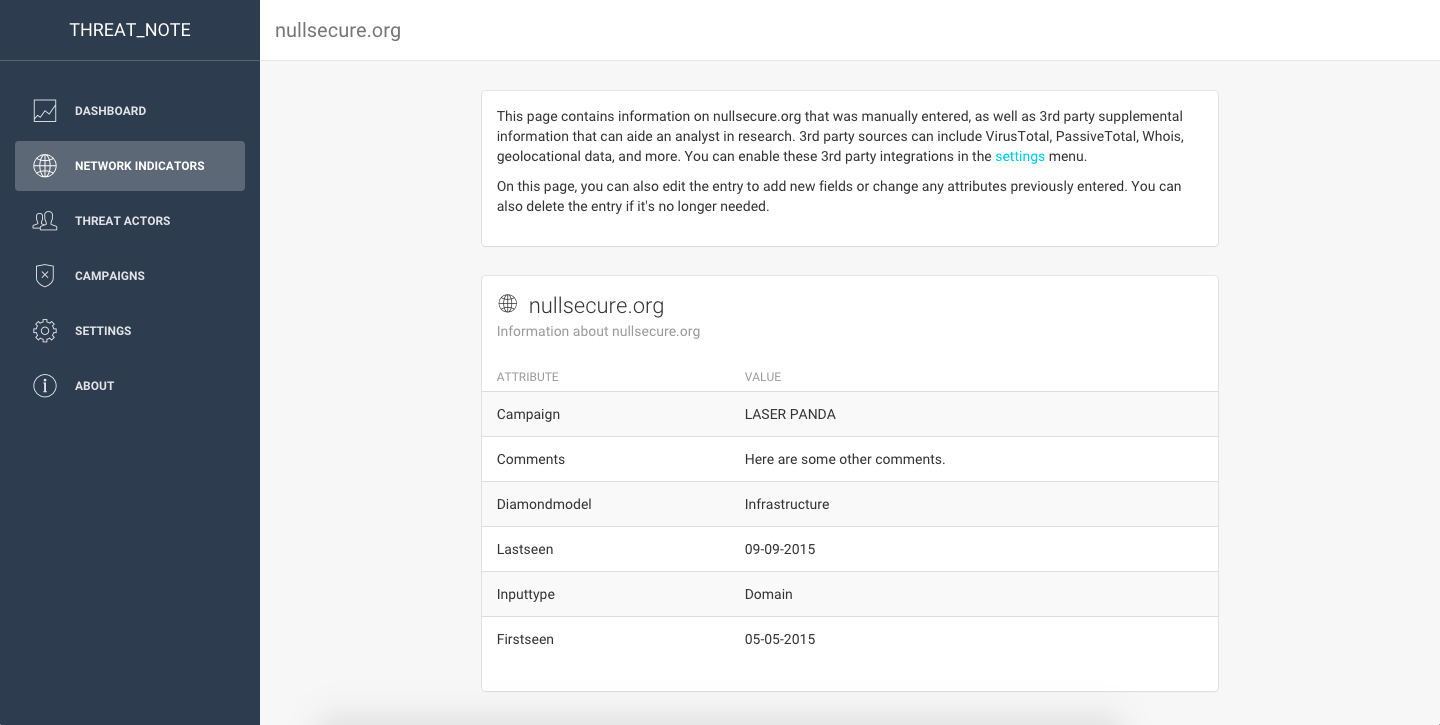
Clicking on a network indicator will pull up the details page for the indicator. If you have Whois information turned on, you’ll see the city and country underneath the indicator.
Clicking on the “New Indicator” button on the Network or Threat Actor page will bring up a page to enter details about your new indicator.
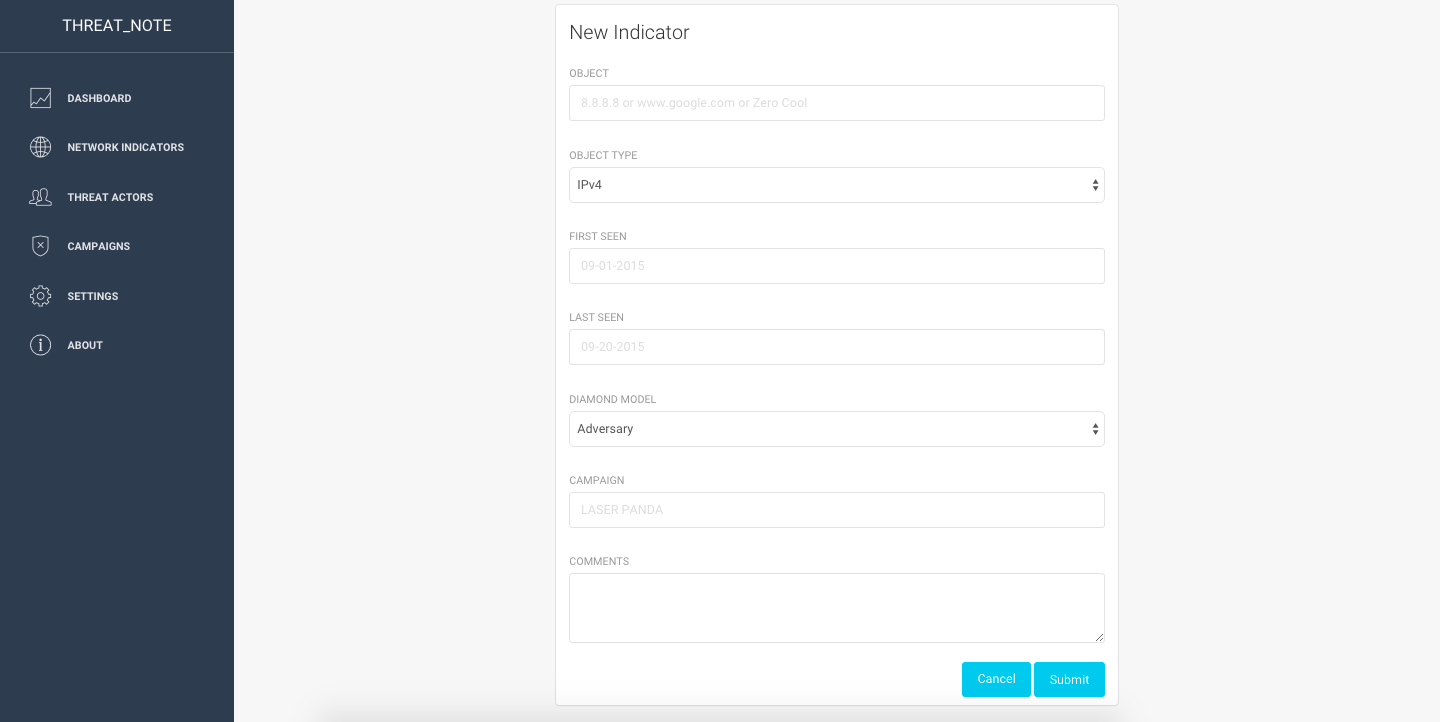
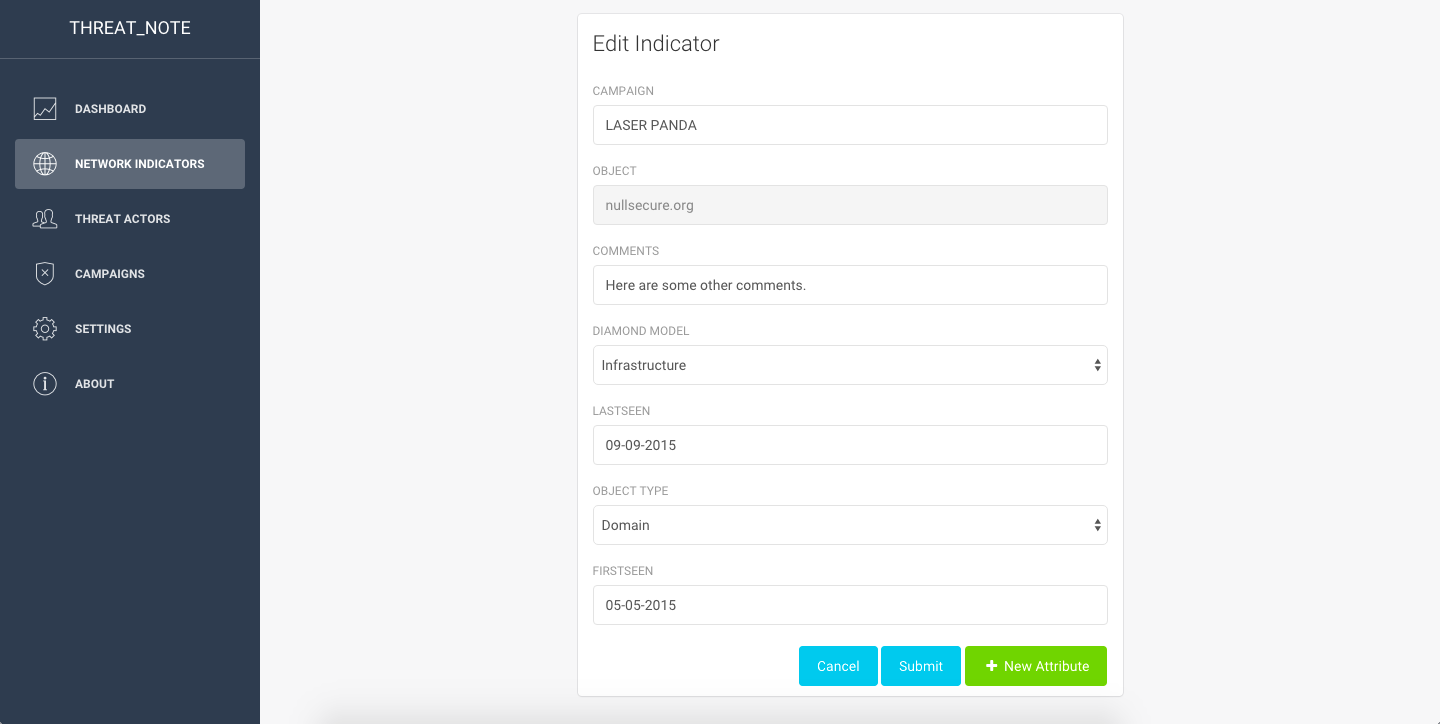
If you click on the “Edit Indicator” icon next to an indicator, you’ll be presented with a page to edit any of the details you previously entered. You can also click on the “New Attribute” icon at the bottom right to add a new attribute to your indicator.
In the screenshot below you can see the “Threat Actors” page, which is similiar to the “Network Indicators” page, however, you’ll only be presented with the Threat Actors you’ve entered.

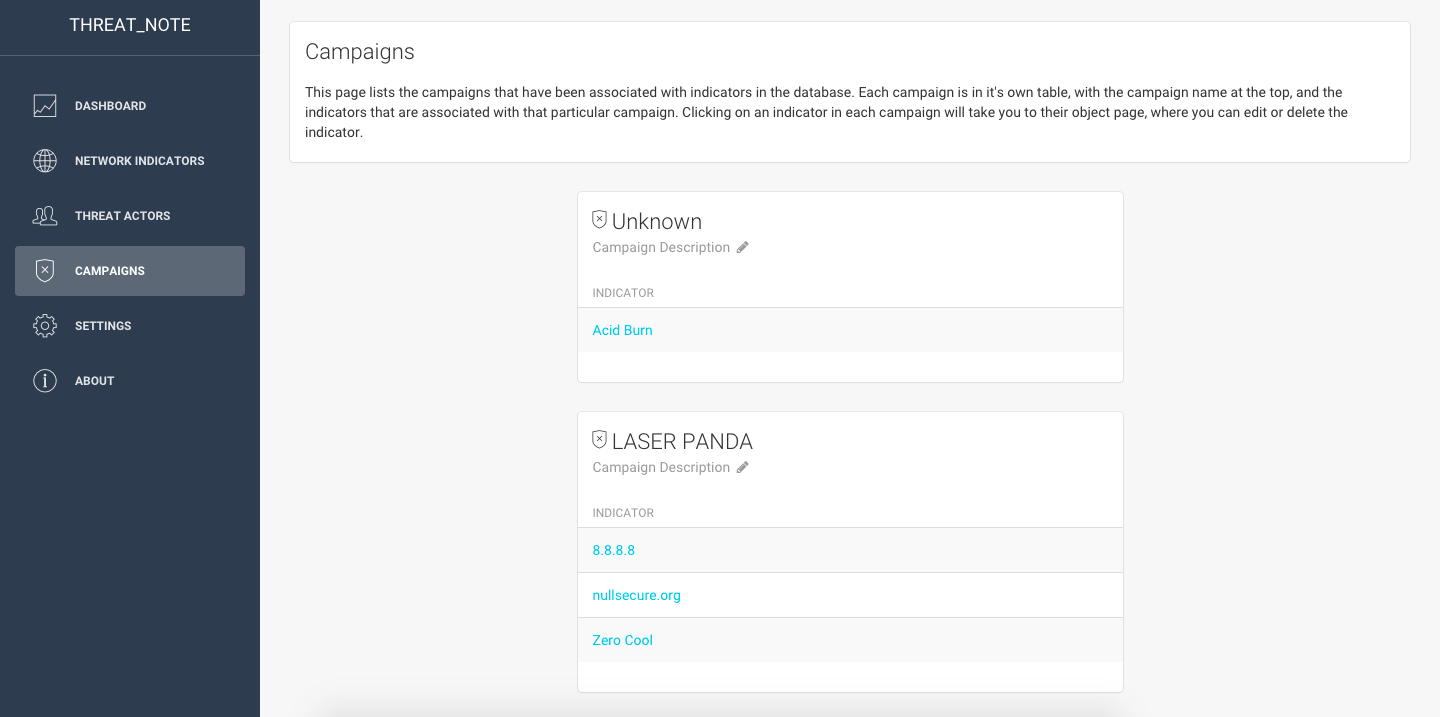
Below is the Campaign page. It contains all of your indicators, broken out by campaign name. Please note that the “Edit Description” button to the right of the campaign description is broken right now, and will be fixed in a future release. Clicking on an indicator will take you to the indicator detail page.
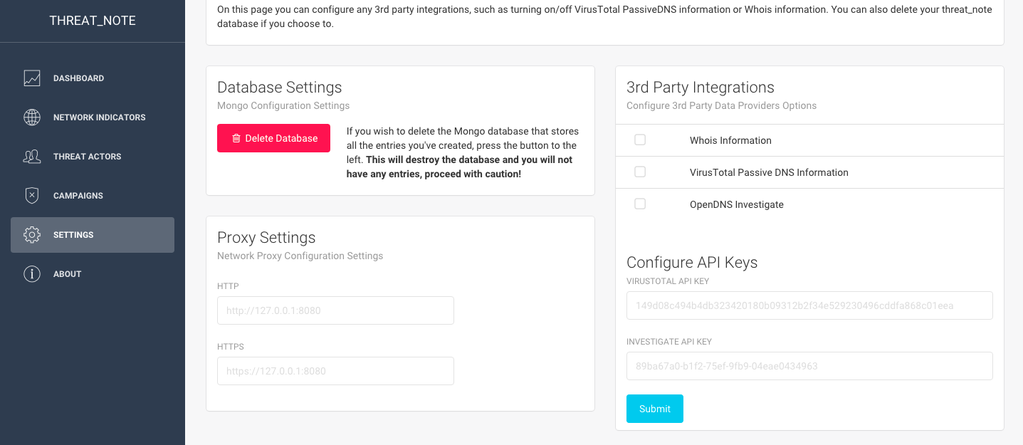
Lastly, here is the Settings page, where you can delete your threat_note database, as well as control any 3rd party integrations, such as Whois data or VirusTotal information. Turning these integrations on can slow down the time to retrieve details about your indicator. A new feature recently added by @alxhrck was the ability to add an HTTP(s) proxy if you need it to connect to 3rd parties. He also recently added support for a new 3rd party integration, OpenDNS Investigate, which can be activated on this page.
Credit: Creative Tim



.png)


