


Dsiem is a security event correlation engine for ELK stack, allowing the platform to be used as a dedicated and full-featured SIEM system.
It provides OSSIM-style correlation for normalized logs/events, perform lookup/query to threat intelligence and vulnerability information sources, and produces risk-adjusted alarms.
Features
- Runs in standalone or clustered mode with NATS as messaging bus between frontend and backend nodes. Along with ELK, this made the entire SIEM platform horizontally scalable.
- OSSIM-style correlation and directive rules, bridging easier transition from OSSIM.
- Alarms enrichment with data from threat intel and vulnerability information sources. Builtin support for Moloch Wise (which supports Alienvault OTX and others) and Nessus CSV exports. Support for other sources can easily be implemented as plugins.
- Instrumentation supported through Metricbeat and/or Elastic APM server. No need extra stack for this purpose.
- Builtin rate and back-pressure control, set the minimum and maximum events/second (EPS) received from Logstash depending on your hardware capacity and acceptable delays in event processing.
- Loosely coupled, designed to be composable with other infrastructure platform, and doesn’t try to do everything. Loose coupling also means that it’s possible to use it as an OSSIM-style correlation engine with non ELK stack if needed.
- Batteries included:
- A directive conversion tool that reads OSSIM XML directive file and translate it to Dsiem-JSON-style config.
- A SIEM plugin creator tool that will read off an existing index pattern from Elasticsearch, and creates the necessary Logstash configuration to clone the relevant fields’ content to it. The tool can also generate basic directive required by it to correlate received events and generate alarm.
- A helper tool to serve Nessus CSV files over the network to it.
- A light weight Angular web UI just for basic alarms management (closing, tagging), and easy pivoting to the relevant indices in Kibana to perform the actual analysis.
- Obviously a cloud-native, twelve-factor app, and all that jazz.
Also Read – Attack Range : Tool To Simulate Attacks Against & Collect Data Into Splunk
How It Works?
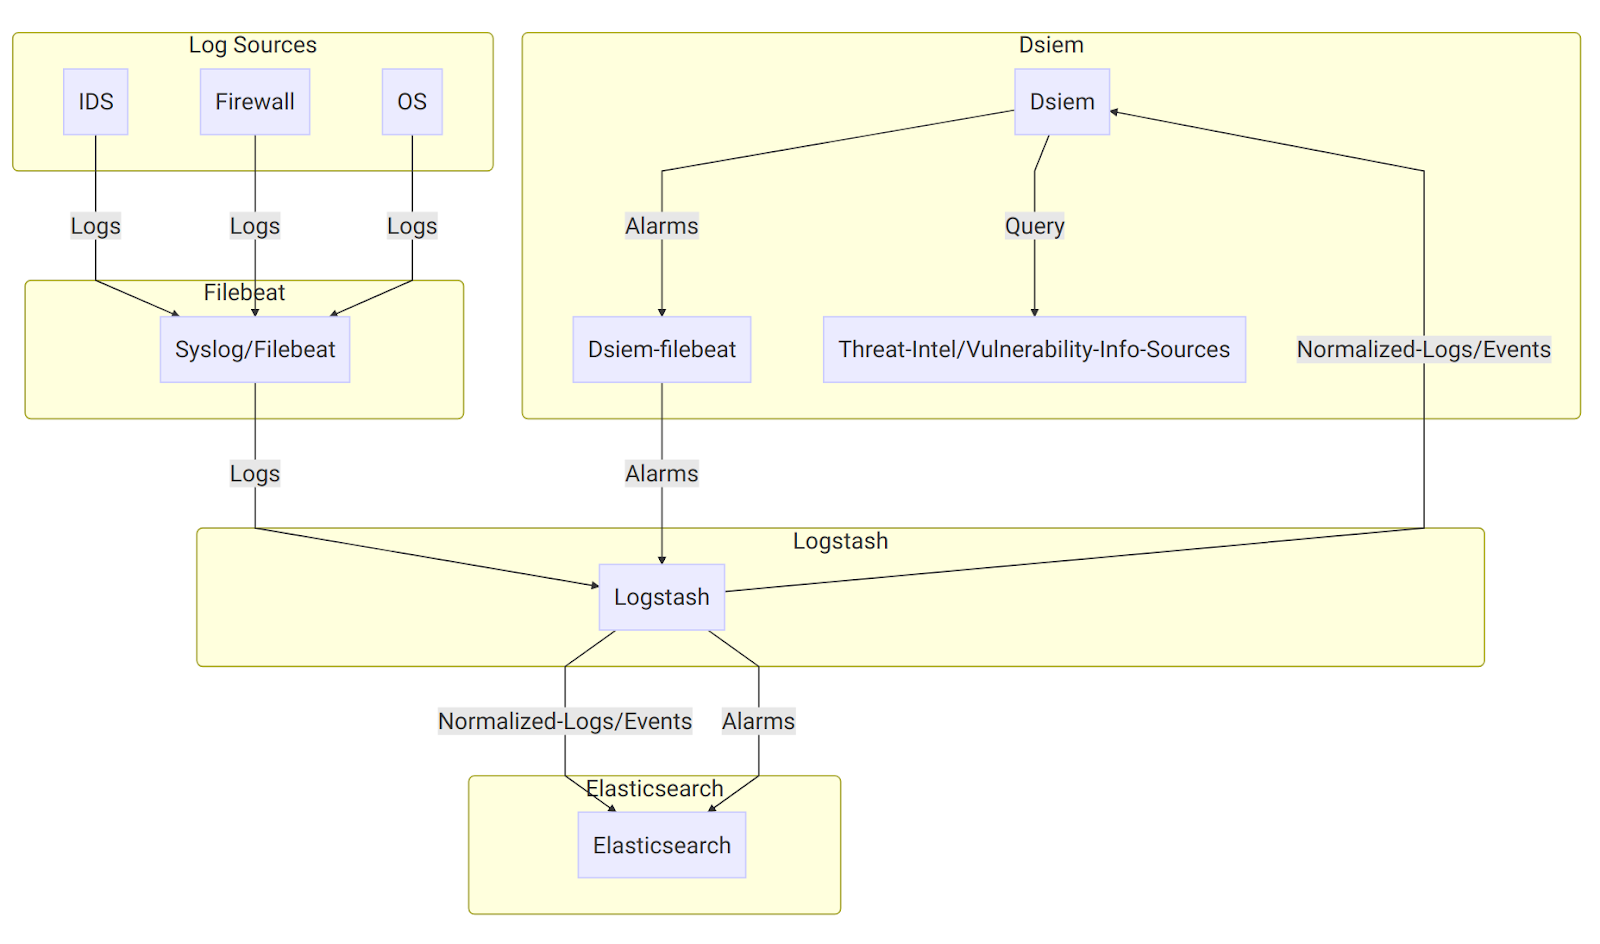
On the diagram above:
- Log sources send their logs to Syslog/Filebeat, which then sends them to Logstash with a unique identifying field. Logstash then parses the logs using different filters based on the log sources type, and sends the results to Elasticsearch, typically creating a single index pattern for each log type (e.g.
suricata-*for logs received from Suricata IDS,ssh-*for SSH logs, etc.). - It uses a special purpose logstash config file to clone incoming event from log sources, right after logstash has done parsing it. Through the same config file, the new cloned event is used (independently from the original event) to collect the required fields like Title, Source IP, Destination IP, and so on.
- The output of the above step is called Normalized Event because it represent logs from multiple different sources in a single format that has a set of common fields. Those events are then sent to it through Logstash HTTP output plugin, and to Elasticsearch under index name pattern
siem_events-*. - It correlates incoming normalized events based on the configured directive rules, perform threat intel and vulnerability lookups, and then generates an alarm if the rules conditions are met. The alarm is then written to a local log file, that is harvested by a local Filebeat configured to send its content to Logstash.
- At the logstash end, there’s another Dsiem special config file that reads those submitted alarms and push them to the final SIEM alarm index in Elasticsearch.
The final result of the above processes is that now we can watch for new alarms and updates to an existing one just by monitoring a single Elasticsearch index.
Installation
The quickest and most reliable way to test Dsiem is to use the supplied Docker Compose files. They include Dsiem, all the required ELK stack, and an example log source (Suricata) pre-configured.
Then after you get a feel on how everything fits together, you can start integrating Dsiem into your existing or custom ELK deployment.
Installing Dsiem
Using Docker Compose
- Install Docker, and Docker Compose.
- Copy this repository from here, unzip it, then open the result in terminal.
$ unzip dsiem-master.zip && cd dsiem-master
- Suricata needs to know which network interface to monitor traffic on. Tell it to use the network interface that has a working Internet connection on your system like this (for
bashshell):
$ export PROMISC_INTERFACE=eth0
- Replace
eth0above with the actual interface name given byifconfigor similar commands. For testing purpose, it’s not necessary to configure the interface to really operate in promiscuous mode. - Set the owner of filebeat config files to root (here’s why):
$ cd deployments/docker && \
sudo chown root $(find conf/filebeat/ conf/filebeat-es/ -name “*.yml”)
- Run ELK, Suricata, and Dsiem in standalone mode:
$ docker-compose pull
$ docker-compose up
- Everything should be up and ready for testing in a few minutes. Here’s things to note about the environment created by
docker-compose:- Dsiem web UI should be accessible from http://localhost:8080/ui, Elasticsearch from http://localhost:9200, and Kibana from http://localhost:5601.
- Suricata comes with Emerging Threats ICMP Info Ruleset enabled and
EXTERNAL_NET: "any", so you can easily trigger a test alarm just by continuously pinging a host in the same subnet. Dsiem comes with an example directive configuration that will intercept this “attack”. - Recorded events will be stored in Elasticsearch index pattern
siem_events-*, and alarms will be insiem_alarms. You can view their content from Kibana or Dsiem web UI.
Importing Kibana Dashboard
- Once Kibana is up at http://localhost:5601, you can import Dsiem dashboard and its dependencies using the following command:
$ ./scripts/kbndashboard-import.sh localhost ./deployments/kibana/dashboard-siem.json
- Do notice that like any Kibana dashboard, Dsiem dashboard also expect the underlying indices (in this case
siem_alarmsandsiem_events-*) to have been created before it can be accessed without error. This means you will need to trigger the test alarm described above before attempting to use the dashboard.
Using Existing ELK
- First make sure you’re already familiar with how Dsiem architecture works by testing it using the Docker Compose method above. Also note that these steps are only tested against ELK version 6.4.2 and 6.8.0, though it should work with any 6.x version (or likely 7.x as well) with minor adjustment.
- Download Dsiem latest binary release and unzip it to a dedicated directory. For instance, to install the Linux version into
/var/dsiem:
# [ “$EUID” -ne 0 ] && echo must be run as root! || (\
export DSIEM_DIR=/var/dsiem && \
mkdir -p $DSIEM_DIR && \
wget https://github.com/defenxor/dsiem/releases/latest/download/dsiem-server_linux_amd64.zip -O /tmp/dsiem.zip && \
unzip /tmp/dsiem.zip -d $DSIEM_DIR && rm -rf /tmp/dsiem.zip && \
cd $DSIEM_DIR
- Let the web UI knows how to reach Elasticsearch and Kibana by entering their URLs into
/var/dsiem/web/dist/assets/config/esconfig.json:
$ cat esconfig.json
{
“elasticsearch”: “http://elasticsearch:9200”,
“kibana”: “http://kibana:5601”
}
- Install the following plugin to your Logstash instance:
- Adjust and deploy the example configuration files for Logstash from here. Consult Logstash documentation if you have problem on this.
- Install Filebeat on the same machine as dsiem, and configure it to use the provided example config file from here.
- Note that you should change
/var/log/dsiemin that example to thelogsdirectory inside dsiem install location (/var/dsiem/logsif using the above example). - Also make sure you adjust the logstash address variable inside
filebeat.ymlfile to point to your Logstash endpoint address.
- Note that you should change
- Set Dsiem to auto-start by using something like this (for systemd-based Linux):
# [ “$EUID” -ne 0 ] && echo must be run as root! || ( \
cat <<EOF > /etc/systemd/system/dsiem.service
[Unit]
Description=Dsiem
After=network.target
[Service]
Type=simple
WorkingDirectory=/var/dsiem
ExecStart=/var/dsiem/dsiem serve
Restart=on-failure
[Install]
WantedBy=multi-user.target
EOF
systemctl daemon-reload && \
systemctl enable dsiem.service && \
systemctl start dsiem.service && \
systemctl status dsiem.service)
- Dsiem web UI should be accessible from http://HostIPAddress:8080/ui
- Import Kibana dashboard from
deployments/kibana/dashboard-siem.json. This step will also install all Kibana index-patterns (siem_alarmsandsiem_events) that will be linked to from Dsiem web UI. $ ./scripts/kbndashboard-import.sh ${your-kibana-IP-or-hostname} ./deployments/kibana/dashboard-siem.json
Uninstalling Dsiem
For docker-compose installation, just run the following:
$ cd dsiem/deployments/docker && \
docker-compose down -v
or
$ cd dsiem/deployments/docker && \
docker-compose -f docker-compose-cluster.yml down -v
For non docker-compose procedure, you will have to undo all the changes made manually, for example:
- Remove the extra logstash plugins and configuration files.
- Uninstall Filebeat.
- Uninstall Dsiem by deleting its directory and systemd unit file, if any.


