


Introduction
Debugging is a significant part of programming. It contributes to improving the program output, locating code errors, finding the root cause of errors, etc. Creating an excellent debugging approach requires experience: it enables a developer to adopt a logical, rational, and analytical approach to solving the problem.
The latest innovation in the debugging process is a method of code debugging called remote debugging. It is particularly useful for debugging codes within the production stage itself and remotely developed codes. Companies are moving more and more towards remote development and using DevOps teams that are spread across multiple countries. Therefore, it is imperative to learn about how remote debugging might be helpful to us.
What is Remote Debugging in Java?
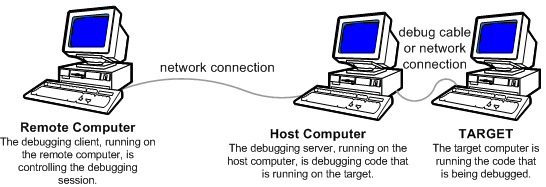
There is a debugger for java programs in multi-tiered architectures called Java Platform Debugger Architecture (JPDA). It has different interfaces, such as JAVA VM Tool Interfaces (JVMTI), JAVA Debug Wire Protocol (JDWP), and JAVA Debug Interfaces (JDI). JDWP is used to transmit the information between JVMTI and JDI or you can say that it is the communication between debugger and debugger.
One can encounter some errors during the remote debugging process. Some of them are listed below:
- Runtime errors: This happens when the program experiences an error while running.
- Logical errors: This error occurs when the developer does not correctly implement the logic in the code. It can lead to memory leaks or buffer overflow if developers have not implemented user input character limits.
- Syntactical errors: Syntactical errors mostly occur due errors in the source code like passing errors or errors in condition writing. For example, in Java, if you’re attempting to print something, you usually use println. However, if you type printl, the command will not execute, thus causing a syntactical error.
- Threading errors: When several threads share one memory, two or more separate threads will interlink with one other and create inconsistent memory data. These threading errors cause problems like deadlock or inconsistent storage.
Why Use Remote Debugging?
There are many circumstances in which remote debugging provides the ideal solution. Most significantly, it improves collaboration between development teams. Let’s talk about its use cases.
- When the target application does not have a local debugger: Developers use remote debugging when the local debugger is not an option due to some reason or the other, like:
- The local debugger is not working properly.
- The logging is decentralized, and a bug is repeated in the case of a decentralized application or distributed system.
- The application works in an environment in which local debugging resources are not sufficient.
- When the application that requires debugging is stored on a vulnerable server but shutting down the servers is not an option.
- When application source files are not accessible from the target system: There can be a couple for reasons, such as:
- The source files are hosted remotely. In that case, the application developer needs to communicate with the target securely.
- The program is working on live data—the developer does not know the state of the operating system in live data.
- The developer and target application are in different locations.
Performing Remote Debugging in Java
Multiple JAVA IDEs for Java debugging like Eclipse, NetBeans, and Visual Studio can work. First, the developer must select the JVM that matches the workflow to move on to debug. Then, they must consider how they may give arguments to the JVM and how to configure the IDE before advancing.
Pass arguments to JVM: As I indicated, JDWP has the initial information and a range of options for debugging. “Xdebug” is a remote debugging option for Java.
Note: Developers need the right configurations for communicating with the remote debugger.
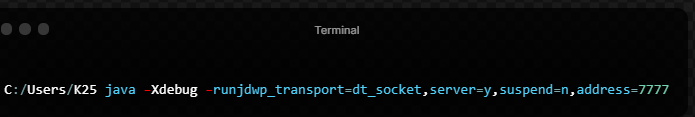
- runjdwp_transport: It tells the JDWP agent to use socket transport. A transport mechanism is necessary.
- Server: Target server’s IP address. “dt socket” is generally used since it’s all platform compatible.
- Address: The port through which the debugger wants to communicate.
- Suspend: You can pause or wait for the debugger to attach the current debugging.
Configuration of IDE: Users now need to set up the IDE to make remote connections after giving parameters and configuration processes that are different for each IDE.
Note: Whenever you start an IDE, you have to enter the correct hostname and IP address for remote connection.
Solutions for Debugging
Debugging can be painful when you need to add a lot of log management code in the program or the application. A tool you can use to help is Lightrun Cloud, which is a free-to-use real-time debugging solution. You can easily add logs, traces, metrics to the production or the staging environment using your IDE or the CLI interface. This can help boost productivity and help you have better control over your code.
Let’s discuss how Lightrun can improve your debugging process.
- Real-Time MTTR: You may easily skip the CI/CD pipelines and detect and resolve errors faster without having to set up a staging environment or reload code for debugging.
- Continuous Debugging Ability: Logs, snapshots, and performance measurements can all be readily added to the live running code. There is no need to define multiple variables; simply click and go.
- Environment Agnostic: Lightrun can be used on-premises as well as on cloud platforms, such as AWS, Azure, and Google Cloud, and it can debug across any infrastructure.
- Stability and Security: To add protection and privacy to your code, Lightrun employs enterprise-level security mechanisms. There is no need to worry about security issues when utilizing Lightrun.
Setting it up
Lightrun Cloud is simple to set up and use. Just create an account, install the plugins and agents, and you are ready to go. You might have problems adding your account in the Lightrun plugin after downloading it in IntelliJ IDEA. In such a case, you just need to use the internal browser instead of IE or Edge.
- Create an account.
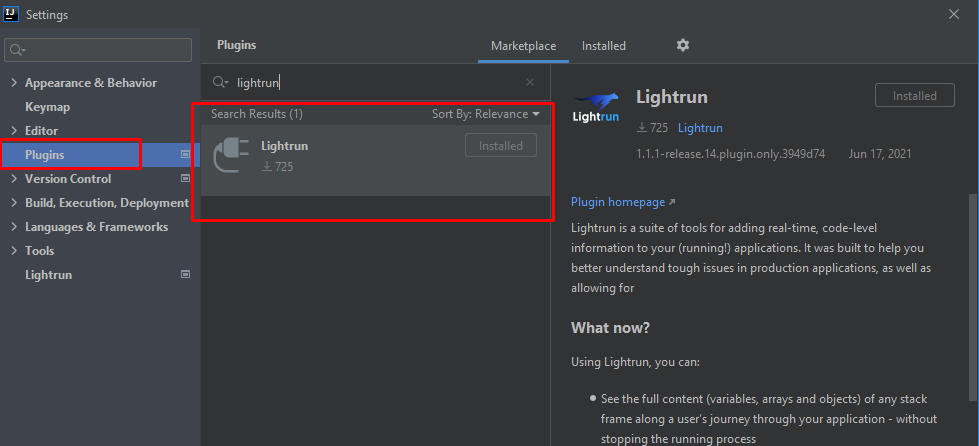
- Open IntelliJ IDEA, go to File > Setting > Plugin and then select Marketplace.
- Download and install the Lightrun plugin.
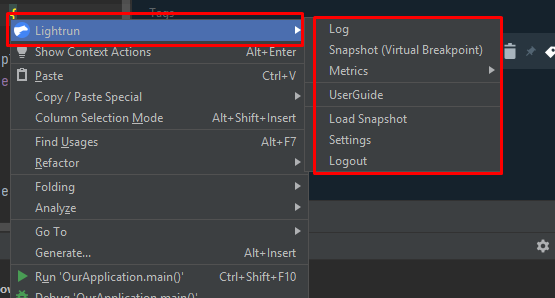
- After installing the plugin, restart the IDE and log in (use the embedded browser, not IE, for this).
- After installing the plugin, you need to install the agent. For that, you need to install WSL and Ubuntu 16.04+.
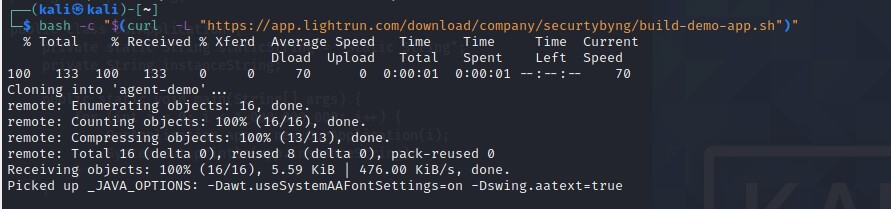
- Download them and compile the demo application associated with your account. To do so, use this command:
bash -c “$(curl -L “https://app.lightrun.com/download/company/securtybyng/build-demo-app.sh”)”
It will produce a result like this:
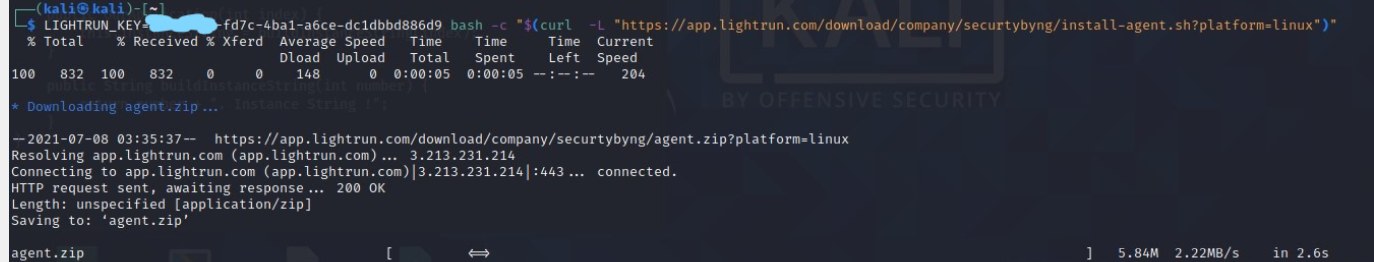
- Then you need to install the Lightrun agent. You can use this command using the key associated with your account.
LIGHTRUN_KEY=<REDACTED> bash -c “$(curl -L “https://app.lightrun.com/download/company/securtybyng/install-agent.sh?platform=linux”)”
- It will produce a result like this.
- Just run the demo application to see that it’s working with this code snippet:
java -agentpath:<path to agent>/lightrun_agent.so -jar <your jar file>
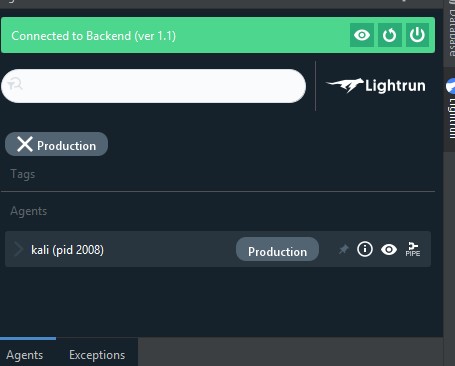
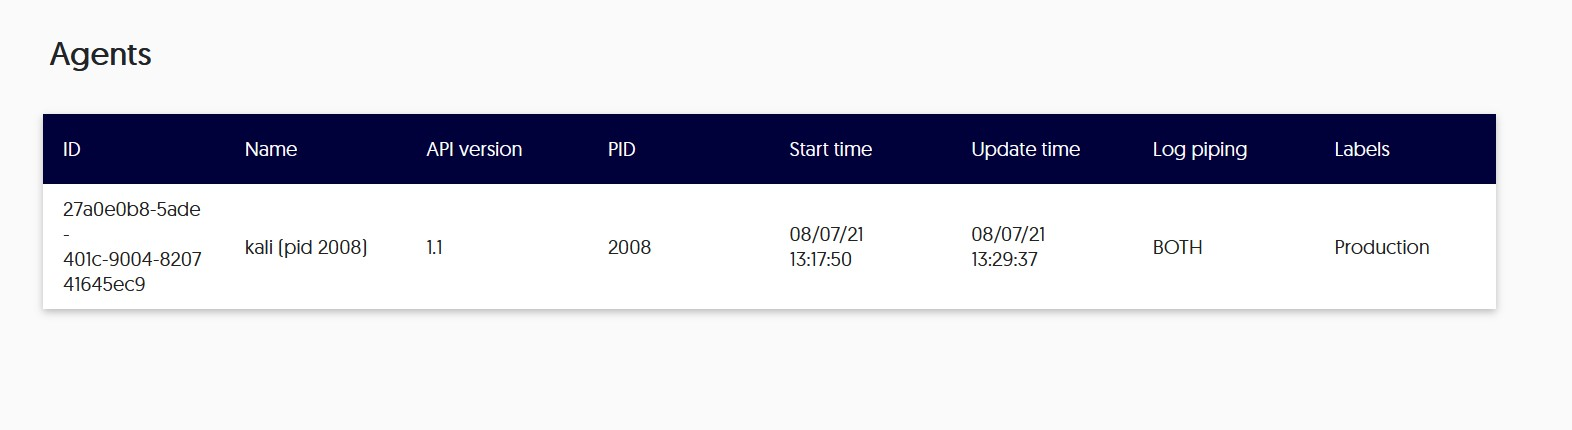
- It will start debugging for you and you can see the output in the dashboard as well.
Conclusion
Think of infrastructures today, where everything is dispersed. Remote debugging is a boon in modern software architecture. It resolves so many developers’ difficulties. But it also creates certain hurdles, and good remote debugging can significantly change that.


