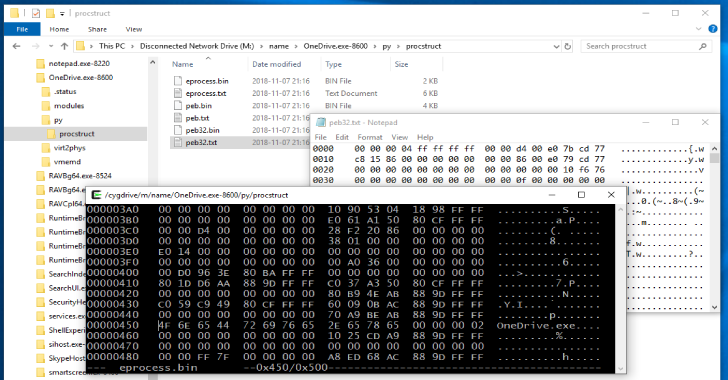
MemProcFS the Memory Process File System is an easy and convenient way of accessing physical memory as files a virtual file system. Easy trivial point and click memory analysis without the need for complicated commandline arguments!
Access memory content and artifacts via files in a mounted virtual file system or via a feature rich application library to include in your own projects!
Analyze memory dump files, live memory via DumpIt or WinPMEM, live memory in read-write mode via linked PCILeech and PCILeech-FPGA devices!
It’s even possible to connect to a remote LeechAgent memory acquisition agent over a secured connection – allowing for remote live memory incident response – even over higher latency low band-width connections!
Use your favorite tools to analyze memory – use your favorite hex editors, your python and powershell scripts, WinDbg or your favorite disassemblers and debuggers – all will work trivally with the Memory Process File System by just reading and writing files!
Include the Memory Process File System in your Python or C/C++ programming projects!
Almost everything in the Memory Process File System is exposed via an easy-to-use API for use in your own projects!
The Plugin friendly architecture allows users to easily extend the Memory Process File System with native C .DLL plugins or Python .py plugins – providing additional analysis capabilities!


Fast and easy memory analysis via mounted file system:
No matter if you have no prior knowledge of memory analysis or are an advanced user the Memory Process File System (and the API) may be useful! Click around the memory objects in the file system.


Extensive Python and C/C++ API:
Everything in the Memory Process File System is exposed as APIs. APIs exist for both C/C++ vmmdll.h and Python vmmpy.py.
The file system itself is made available virtually via the API without the need to mount it. Specialized process analysis and process alteration functionality is made easy by calling API functionality.
It is possible to read both virtual process memory as well as physical memory! The example below shows reading 0x20 bytes from physical address 0x1000:
>>> from vmmpy import *
>>> VmmPy_Initialize(‘c:/temp/win10_memdump.raw’)
>>> print(VmmPy_UtilFillHexAscii(VmmPy_MemRead(-1, 0x1000, 0x20))) 0000 e9 4d 06 00 01 00 00 00 01 00 00 00 3f 00 18 10 .M……….?… 0010 00 00 00 00 00 00 00 00 00 00 00 00 00 00 00 00 …………….
Modular Plugin Architecture:
Anyone is able to extend the Memory Process File System with custom plugins!
It is as easy as dropping a python file in the correct directory or compiling a tiny C DLL.
Existing functionality is already implemented as well documented C and Python plugins!
Installing:
Windows
Download or clone the Memory Process File System github repository. Pre-built binaries are found in the files folder.
If the Memory Process File System is used as an API it is only dependant on the Microsoft Visual C++ Redistributables for Visual Studio 2017 (see below).
The Memory Process File System is dependant on the LeechCore project for memory acquisition.
The necessary leechcore.dll file is already pre-built and included in the files folder.
The Memory Process File System is also dependant in the Microsoft Visual C++ Redistributables for Visual Studio 2017.
They can be downloaded from Microsoft here. Alternatively, if installing the Dokany file system driver please install the DokanSetup_redist version and it will install the required redistributables.
Mounting the file system requires the Dokany file system library to be installed.
Please download and install the latest version of Dokany at: https://github.com/dokan-dev/dokany/releases/latest It is recommended to download and install the DokanSetup_redist version.
Python support requires Python 3.6 or later. The user may specify the path to the Python installation with the command line parameter -pythonhome, alternatively download Python 3.7 – Windows x86-64 embeddable zip file and unzip its contents into the files/python folder when using Python modules in the file system.
To use the Python API a normal 64-bit Python 3.6 or later installation for Windows is required.
To capture live memory (without PCILeech FPGA hardware) download DumpIt and start the Memory Process File System via the DumpIt /LIVEKD mode.
Alternatively, get WinPMEM by downloading the most recent signed WinPMEM driver and place it alongside MemProcFS – detailed instructions in the LeechCore Wiki.
PCILeech FPGA will require hardware as well as FTD3XX.dll to be dropped in the files folder. Please check out the LeechCore project for instructions.
Linux
The memory process file system is not yet supported on Linux.
Examples:
Start the Memory Process File System from the command line – possibly by using one of the examples below.
Or register the memory dump file extension with MemProcFS.exe so that the file system is automatically mounted when double-clicking on a memory dump file!
- mount the memory dump file as default M:
- memprocfs.exe -device c:\temp\win10x64-dump.raw
- mount the memory dump file as default M: with extra verbosity:
- memprocfs.exe -device c:\temp\win10x64-dump.raw -v
- mount the memory dump file as default M: with extra extra verbosity:
- memprocfs.exe -device c:\temp\win10x64-dump.raw -v -vv
- mount the memory dump file as S:
- memprocfs.exe -mount s -device c:\temp\win10x64-dump.raw
- mount live target memory, in verbose read-only mode, with DumpIt in /LIVEKD mode:
- DumpIt.exe /LIVEKD /A memprocfs.exe /C “-v”
- mount live target memory, in read-only mode, with WinPMEM driver:
- memprocfs.exe -device pmem
- mount live target memory, in read/write mode, with PCILeech FPGA memory acquisition device:
- memprocfs.exe -device fpga
- mount live target memory, in read/write mode, with TotalMeltdown vulnerability acquisition device:
- memprocfs.exe -device totalmeltdown
- mount an arbitrary x64 memory dump by specifying the process or kernel page table base in the cr3 option:
- memprocfs.exe -device c:\temp\unknown-x64-dump.raw -cr3 0x1aa000
Demo


