


Netdata is distributed, real-time, performance and health monitoring for systems and applications. It is a highly-optimized monitoring agent you install on all your systems and containers.
Netdata provides unparalleled insights, in real-time, of everything happening on the systems it runs (including web servers, databases, applications), using highly interactive web dashboards. It can run autonomously, without any third-party components, or it can be integrated to existing monitoring toolchains (Prometheus, Graphite, OpenTSDB, Kafka, Grafana, and more).
Netdata is fast and efficient, designed to permanently run on all systems (physical & virtual servers, containers, IoT devices), without disrupting their core function.
Netdata is free, open-source software and it currently runs on Linux, FreeBSD, and MacOS, along with other systems derived from them, such as Kubernetes and Docker.
People get addicted to Netdata. Once you use it on your systems, there is no going back! You’ve been warned…
Want to see Netdata live? Check out any of our live demos.
Registry
When you install multiple Netdata, they are integrated into one distributed application, via a Netdata registry.
This is a web browser feature and it allows us to count the number of unique users and unique Netdata servers installed. The following information comes from the global public Netdata registry we run:
Quickstart
To install Netdata from source on any Linux system (physical, virtual, container, IoT, edge) and keep it up to date with our nightly releases automatically, run the following:
#make sure you run bash for your shell
bash
#install Netdata directly from GitHub source
bash <(curl -Ss https://my-netdata.io/kickstart.sh)
Starting with v1.12, Netdata collects anonymous usage information by default and sends it to Google Analytics.
The usage statistics are vital for us, as we use them to discover bugs and priortize new features. We thank you for actively contributing to Netdata’s future.
The above command will:
- Install any required packages on your system (it will ask you to confirm before doing so)
- Compile it, install it, and start it.
To try Netdata in a Docker container, run this:
docker run -d –name=netdata \
-p 19999:19999 \
-v /etc/passwd:/host/etc/passwd:ro \
-v /etc/group:/host/etc/group:ro \
-v /proc:/host/proc:ro \
-v /sys:/host/sys:ro \
-v /var/run/docker.sock:/var/run/docker.sock:ro \
–cap-add SYS_PTRACE \
–security-opt apparmor=unconfined \
netdata/netdata
Also Read – MISP : Dashboard For A Real Time Overview Of Threat Intelligence From MISP Instances
Why Netdata?
Netdata has a quite different approach to monitoring.
Netdata is a monitoring agent you install on all your systems. It is:
- A metrics collector for system and application metrics (including web servers, databases, containers, and much more),
- A custom database engine to store recent metrics in memory and “spill” historical metrics to disk for efficient long-term storage,
- A super fast, interactive, and modern metrics visualizer optimized for anomaly detection,
- And an alarms notification engine – an advanced watchdog for detecting performance and availability issues
All the above, are packaged together in a very flexible, extremely modular, distributed application.
How it works?
Netdata is a highly efficient, highly modular, metrics management engine. Its lockless design makes it ideal for concurrent operations on the metrics.
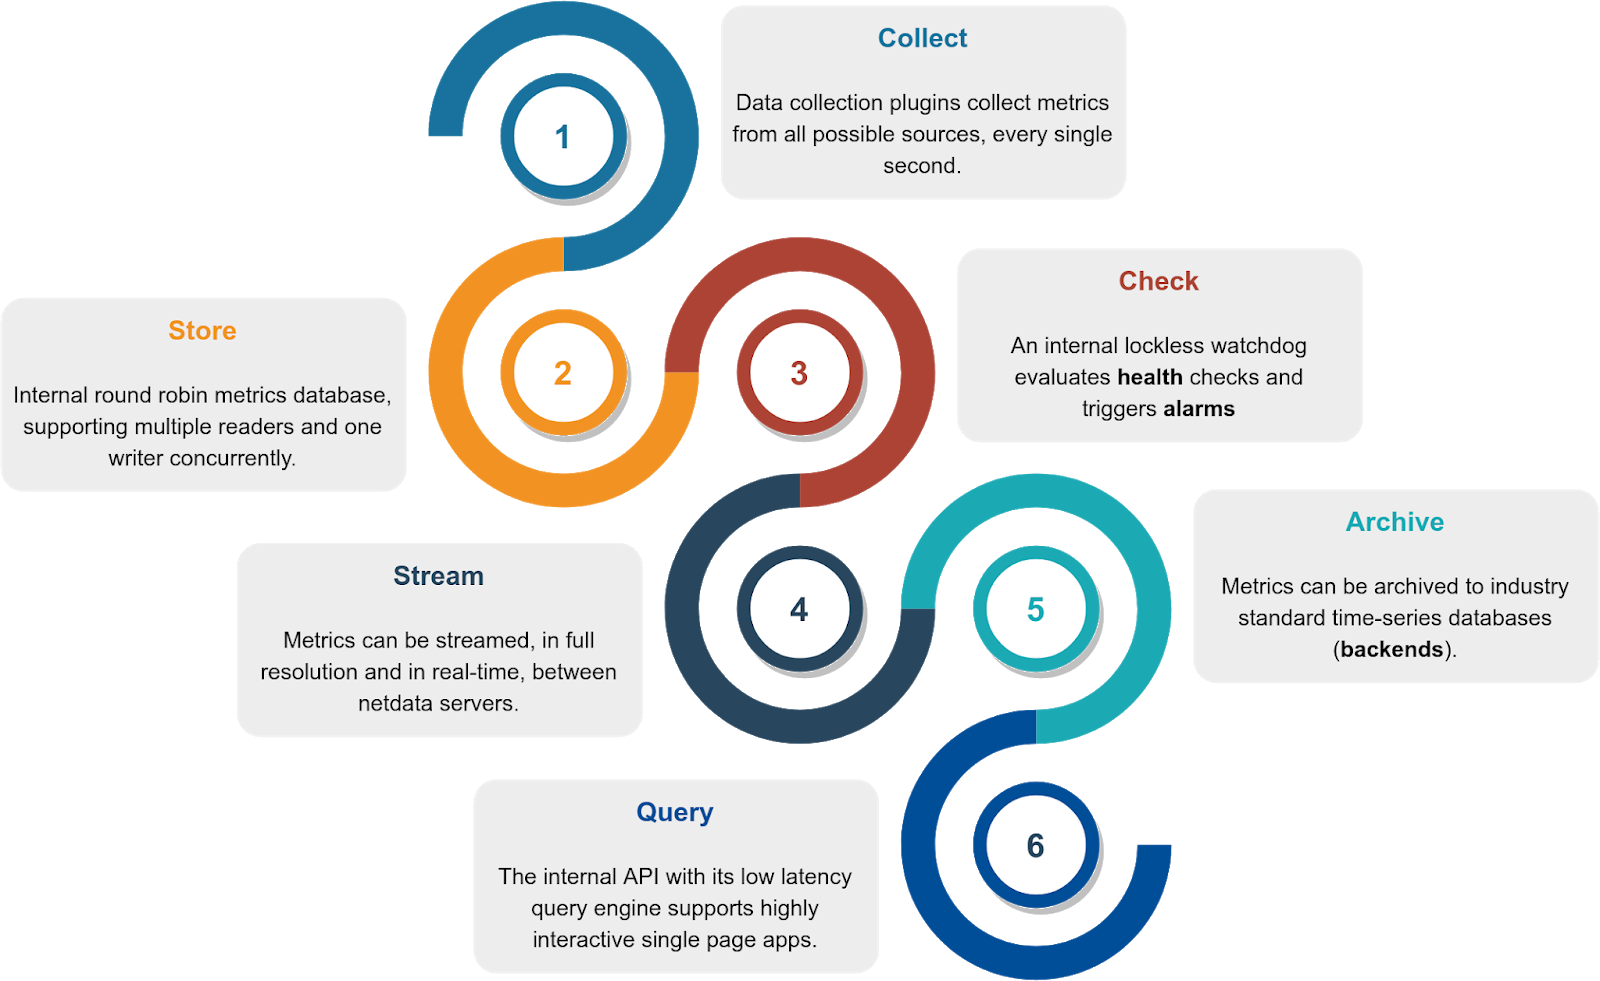
This is how it works:
| Function | Description | Documentation |
|---|---|---|
| Collect | Multiple independent data collection workers are collecting metrics from their sources using the optimal protocol for each application and push the metrics to the database. Each data collection worker has lockless write access to the metrics it collects. | collectors |
| Store | Metrics are first stored in RAM in a custom database engine that then “spills” historical metrics to disk for efficient long-term metrics storage. | database |
| Check | A lockless independent watchdog is evaluating health checks on the collected metrics, triggers alarms, maintains a health transaction log and dispatches alarm notifications. | health |
| Stream | A lockless independent worker is streaming metrics, in full detail and in real-time, to remote Netdata servers, as soon as they are collected. | streaming |
| Archive | A lockless independent worker is down-sampling the metrics and pushes them to backend time-series databases. | backends |
| Query | Multiple independent workers are attached to the internal web server, servicing API requests, including data queries. | web/api |
The result is a highly efficient, low-latency system, supporting multiple readers and one writer on each metric.
Features
General:
- 1s granularity – The highest possible resolution for all metrics.
- Unlimited metrics – Netdata collects all the available metrics—the more, the better.
- 1% CPU utilization of a single core – It’s unbelievably optimized.
- A few MB of RAM – The low-memory round-robin option uses 25MB RAM, and you can resize it.
- Minimal disk I/O – While running, Netdata only writes historical metrics and reads
errorandaccesslogs. - Zero configuration – Netdata auto-detects everything, and can collect up to 10,000 metrics per server out of the box.
- Zero maintenance – You just run it. Netdata does the rest.
- Zero dependencies – Netdata runs a custom web server for its static web files and its web API (though its plugins may require additional libraries, depending on the applications monitored).
- Scales to infinity – You can install it on all your servers, containers, VMs, and IoT devices. Metrics are not centralized by default, so there is no limit.
- Several operating modes – Autonomous host monitoring (the default), headless data collector, forwarding proxy, store and forward proxy, central multi-host monitoring, in all possible configurations. Each node may have different metrics retention policies and run with or without health monitoring.


