


Tarian is a tool to protect your applications running on Kubernetes from malicious attacks by pre-registering your trusted processes and trusted file signatures. Tarian will detect unknown processes and changes to the registered files, then it will send alerts and take an automated action. Save your K8s environment from Ransomware!
We want to maintain this as an open-source project to fight against the attacks on our favorite Kubernetes ecosystem. By continuous contribution, we can fight threats together as a community.
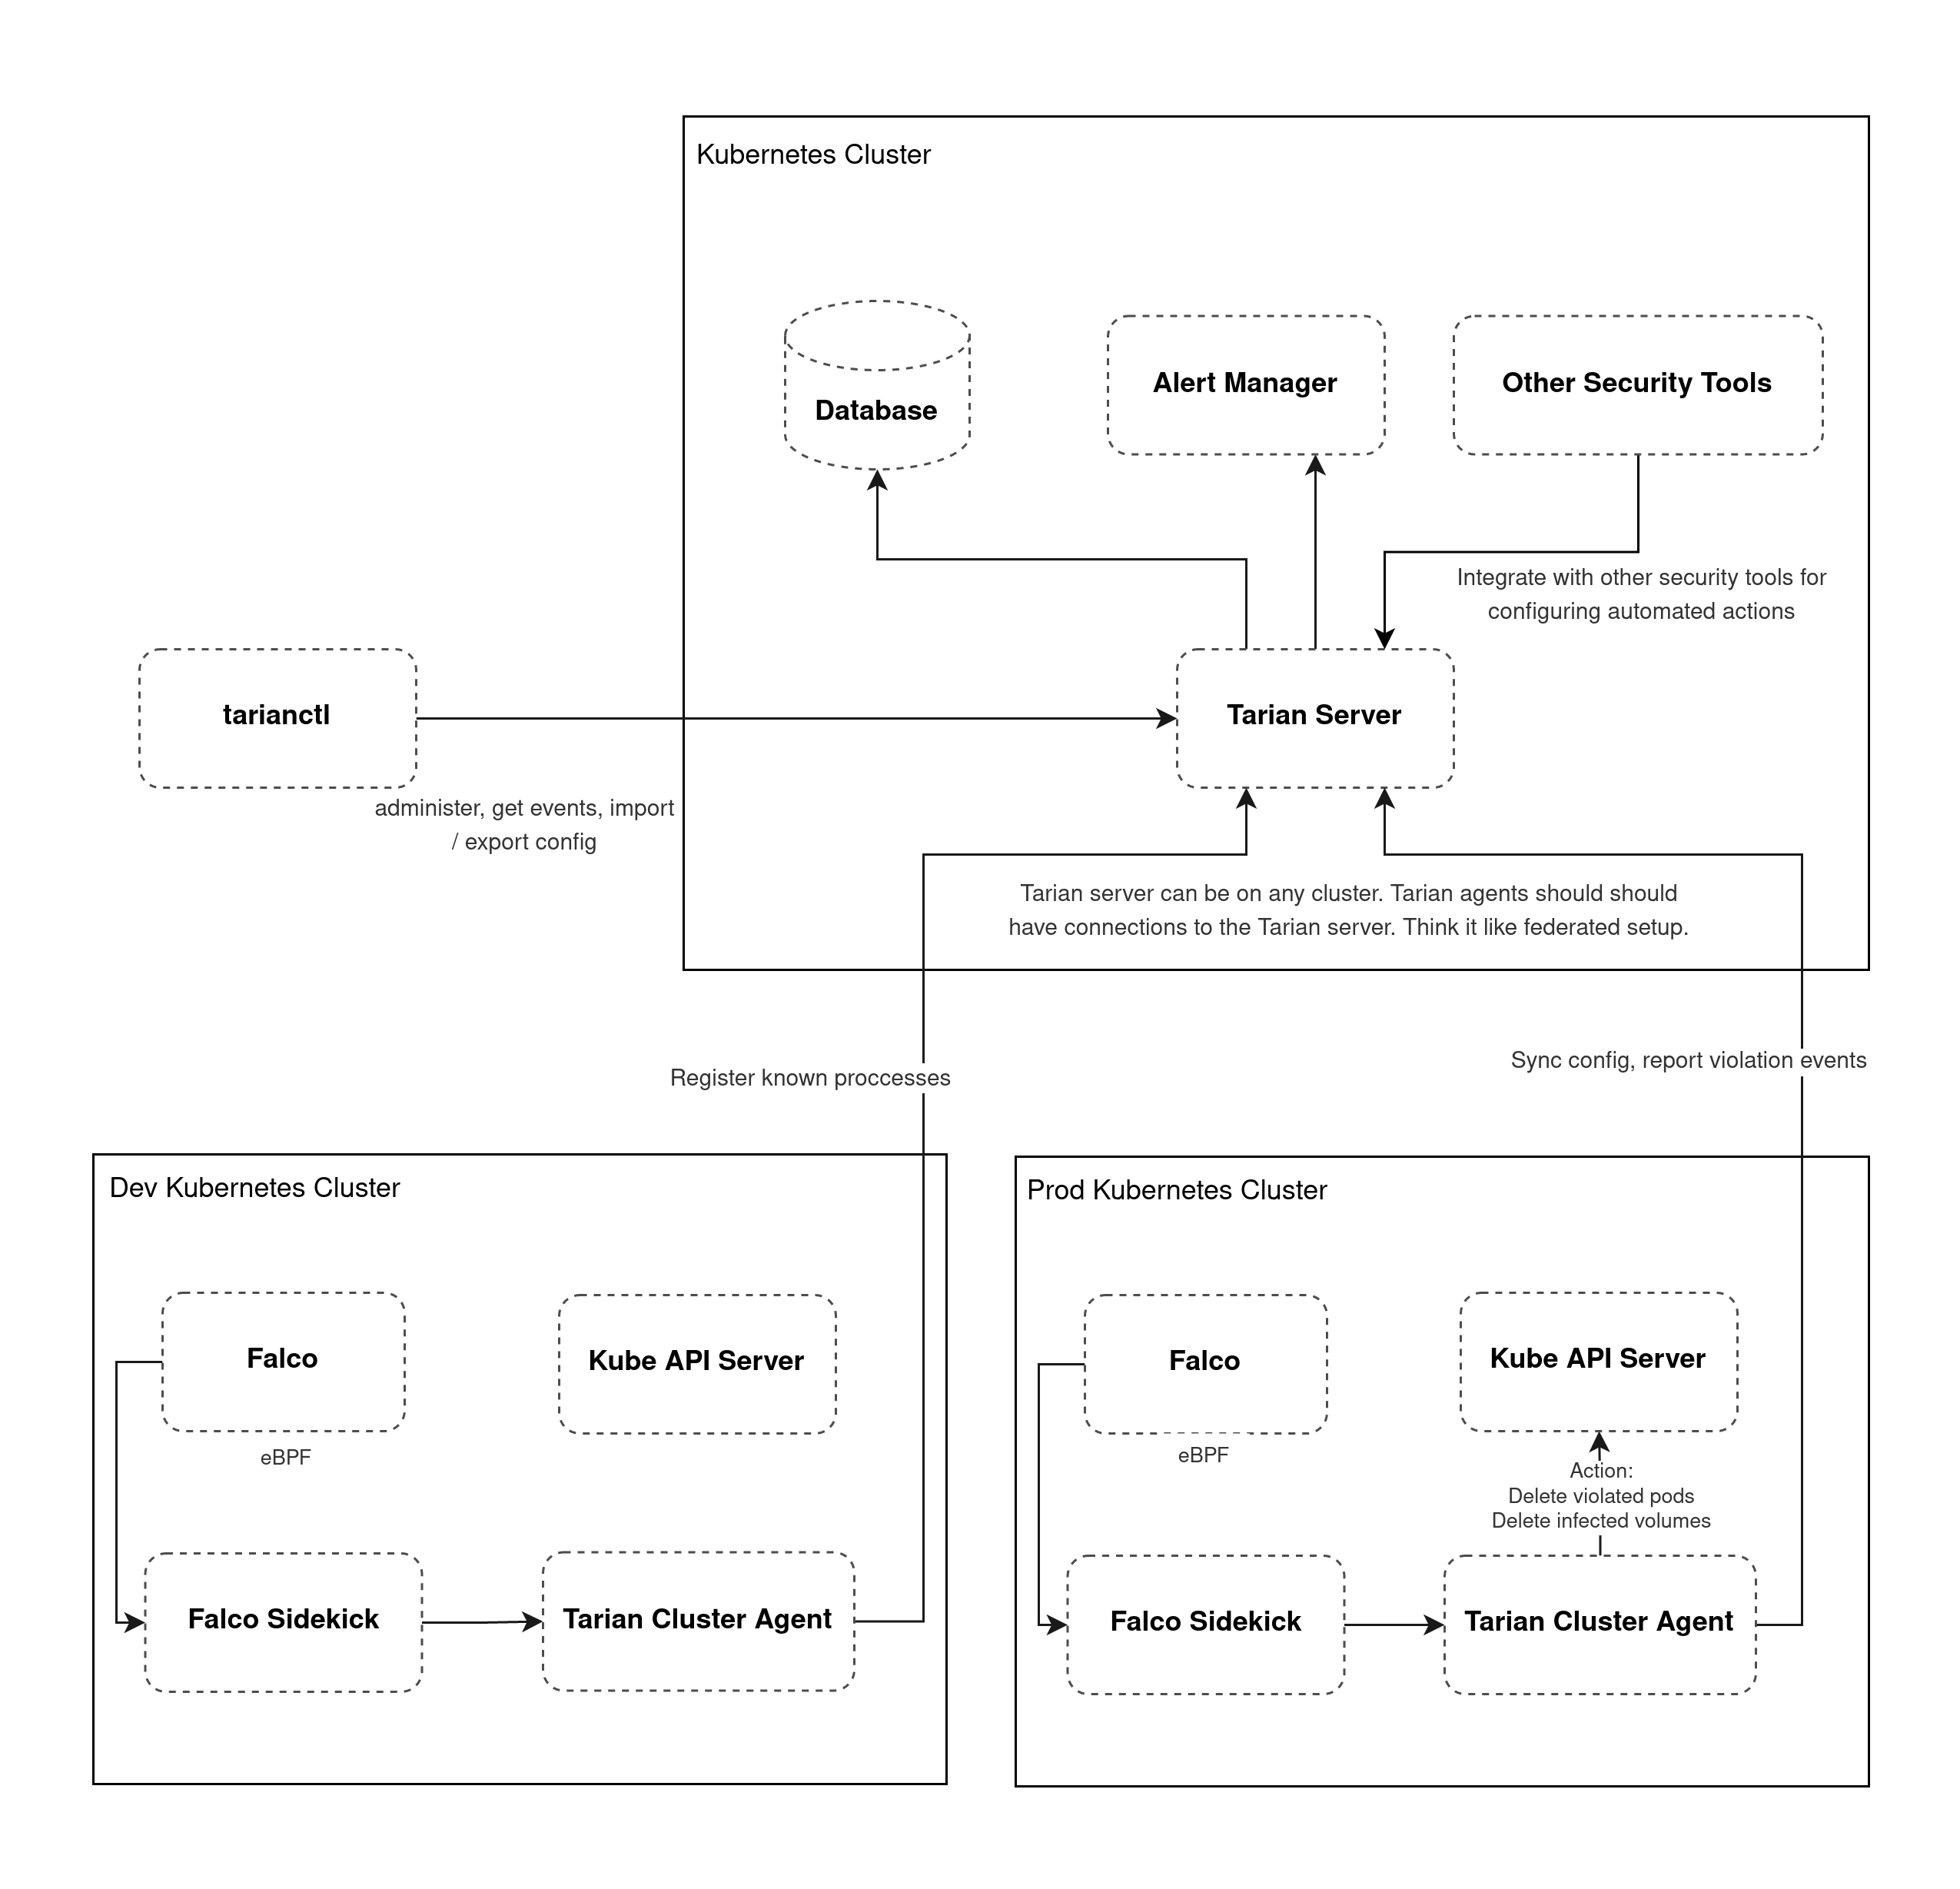
How does Tarian work?
Tarian Cluster Agent runs in Kubernetes cluster detecting unknown processes and unknown changes to files, report them to Tarian Server, and optionally take action: delete the violated pod. It leverages Falco with a custom rule for detecting new processes executed. For file change detection, Tarian Cluster Agent injects a sidecar container in your main application’s pod which will check file checksums in the configured path and compare them with the registered checksums in Tarian Server. Tarian will be a part of your Application’s pod from dev to prod environment, hence you can register to your Tarian DB what is supposed to be happening & running in your container + file signatures to be watched + what can be notified + action to take (self destroy the pod) based on changes detected. Shift-left your detection mechanism!
What if an unknown change happens inside the container which is not in Tarian’s registration DB, how does Tarian react to it?
If an unknown change happens, Tarian can simply notify observed analytics to your Security Team. Then your Security Engineers can register that change in Tarian DB whether it’s considered a threat or not. Also, based on their analysis they can configure what action to take when that change happens again.
How does the contribution of community helps to fight against the threats via Tarian?
Any new detection analyzed & marked as a threat by your Security Experts, if they choose, can be shared to the open-source Tarian community DB with all the logs, strings to look for, observation, transparency, actions to configure, … Basically anything the Experts want to warn about & share with the community. You can use that information as a Tarian user and configure actions in the Tarian app which is used in your environment. This is basically a mechanism to share info about threats & what to do with them. This helps everyone using Tarian to take actions together in their respective K8s environments by sharing their knowledge & experience.
What kind of action(s) would Tarian take based on known threat(s)?
Tarian would simply self destroy the pod it’s running on. If the malware/virus spreads to the rest of the environment, well you know what happens. So, Tarian is basically designed to help reduce the risk as much as possible by destroying pods. Provisioning a new pod will be taken care of by K8s deployment. Tarian will only do destruction of the pods only if you tell Tarian to do so. If you don’t want any actions to happen, you don’t have to configure or trigger any; you can simply tell Tarian to just notify you. Tarian basically does what you want to be done to reduce the risk.
Why another new security tool when there are many tools available already, like Falco, Kube-Hunter, Kube-Bench, Calico Enterprise Security, and many more security tools (open-source & commercial) that can detect & prevent threats at network, infra & application level? Why Tarian?
The main reason Tarian was born is to fight against threats in Kubernetes together as a community. Another reason was, what if there is still some sophisticated attack which is capable of penetrating every layer of your security, able to reach your runtime app (Remote Code Execution) and your storage volumes, and capable of spreading to damage or lock your infra & data?! What do you want to do about such attacks, especially which turns into ransomware. Tarian is designed to reduce such risks, by taking action(s). We know that Tarian is not the ultimate solution, but we are confident that it can help reduce risks especially when knowledge is shared continuously by the community. From a technical perspective, Tarian can help reduce the risk by destroying the infected resources.
Prerequisites
A kubernetes cluster that supports running Falco
kubectl create namespace tarian-system
kubectl create namespace falco
Install Falco with custom rules from Tarian
Save this to falco-values.yaml
falcosidekick:
enabled: true
config:
webhook:
address: http://tarian-cluster-agent.tarian-system.svc:8088
Then install Falco using Helm:
helm repo add falcosecurity https://falcosecurity.github.io/charts
helm repo update
helm upgrade -i falco falcosecurity/falco -n falco -f falco-values.yaml \
–set-file customRules.”tarian_rules.yaml”=https://raw.githubusercontent.com/kube-tarian/tarian/main/dev/falco/tarian_rules.yaml
On GKE, falco uses ebpf, so you will need to add
–set ebpf.enabled=true
Setup a Postgresql Database
You can use a DB as a service from your Cloud Services or you can also run by yourself in the cluster. For example to install the DB in the cluster, run:
helm repo add bitnami https://charts.bitnami.com/bitnami
helm install tarian-postgresql bitnami/postgresql -n tarian-system \
–set postgresqlUsername=postgres \
–set postgresqlPassword=tarian \
–set postgresqlDatabase=tarian
Install Tarian
- Install tarian using Helm
helm repo add tarian https://kube-tarian.github.io/tarian
helm repo update
helm upgrade -i tarian-server tarian/tarian-server –devel -n tarian-system
helm upgrade -i tarian-cluster-agent tarian/tarian-cluster-agent –devel -n tarian-system
- Wait for all the pods to be ready
kubectl wait –for=condition=ready pod –all -n tarian-system
- Run database migration to create the required tables
kubectl exec -ti deploy/tarian-server -n tarian-system — ./tarian-server db migrate
After the above step, you should see falco alert in tarianctl get events (See the following Usage sections).
Configuration
See helm chart values for
- tarian-server
- tarian-cluster-agent
Cloud / Vendor specific configuration
Private GKE cluster by default creates firewall rules to restrict master to nodes communication only on ports 443 and 10250. To inject tarian-pod-agent container, tarian uses a mutating admission webhook. The webhook server runs on port 9443. So, we need to create a new firewall rule to allow ingress from master IP address range to nodes on tcp port 9443.
Usage
Use tarianctl to control tarian-server
- Download from Github release page
- Extract the file and copy tarianctl to your PATH directory
- Expose tarian-server to your machine, through Ingress or port-forward. For this example, we’ll use port-forward:
kubectl port-forward svc/tarian-server -n tarian-system 41051:80
Configure server address with env var
export TARIAN_SERVER_ADDRESS=localhost:41051
To see violation events
tarianctl get events
Add a process constraint
tarianctl add constraint –name nginx –namespace default \
–match-labels run=nginx \
–allowed-processes=pause,tarian-pod-agent,nginx
tarianctl get constraints
Add a file constraint
tarianctl add constraint –name nginx-files –namespace default \
–match-labels run=nginx \
–allowed-file-sha256sums=/usr/share/nginx/html/index.html=38ffd4972ae513a0c79a8be4573403edcd709f0f572105362b08ff50cf6de521
tarianctl get constraints
Run tarian agent in a pod
Then after the constraints are created, we inject tarian-pod-agent to the pod by adding an annotation:
metadata:
annotations:
pod-agent.k8s.tarian.dev/threat-scan: “true”
Pod with this annotation will have an additional container injected (tarian-pod-agent). The tarian-pod-agent container will continuously verify the runtime environment based on the registered constraints. Any violation would be reported, which would be accessible with tarianctl get events.
Demo: Try a pod that violates the constraints
kubectl apply -f https://raw.githubusercontent.com/kube-tarian/tarian/main/dev/config/monitored-pod/configmap.yaml
kubectl apply -f https://raw.githubusercontent.com/kube-tarian/tarian/main/dev/config/monitored-pod/pod.yaml
wait for it to become ready
kubectl wait –for=condition=ready pod nginx
simulate unknown process runs
kubectl exec -ti nginx -c nginx — sleep 15
you should see it reported in tarian
tarianctl get events
Alert Manager Integration
Tarian comes with Prometheus Alert Manager by default. If you want to use another alert manager instance:
helm install tarian-server tarian/tarian-server –devel \
–set server.alert.alertManagerAddress=http://alertmanager.monitoring.svc:9093 \
–set alertManager.install=false \
-n tarian-system


