


Vimana is a modular security framework designed to audit Python web applications.
Framework Structure
The base of the Vimana is composed of crawlers focused on frameworks (in addition to the generic ones for web), trackers, discovery, fuzzer, parser among other types of modules. The main idea, from where the framework emerged, is to identify, through a blackbox approach, configuration flaws and inadequate and/or insufficient implementations that allow unhandled exceptions to be triggered. Depending on the framework settings (or specific libs even when not using frameworks, for example raw wsgi) this can lead to leakage of sensitive and critical information that can allow to compromising the entire application, server, apis, databases, services and any third part software with tokens, secrets or api keys in current exposed environment variables.
Another important step performed by Vimana is to obtain and reconstruct the source code snippets of the affected modules (leaked by exceptions) that allow the discovery of hardcoded credentials, connection strings to databases, vulnerable libraries, in addition to allowing the analysis of logic of the application of a mixed perspective between the black and whitebox approaches, since the initial analysis starts from a blind test, but ends up allowing access to code snippets.
Getting Started with Vimana
The easiest way is through Docker image build script:
sudo git clone https://github.com/s4dhul4bs/vimana-framework.git
cd vimana-framework && sudo ./vmnf_build
If the build runs smoothly, you will see the about screen (README image above)
If you prefer you can follow the same steps as the script manually to build the image:
timedatectl set-ntp yes
sudo git clone https://github.com/s4dhul4bs/vimana-framework.git
cd vimana-framework
sudo docker build –no-cache=true –network=host -t vimana_framework:alpha .
Once the image has been successfully created, you can start Vimana as follows:
sudo docker run -it --name vimana vimana_framework:alpha about
And the same image will be displayed.
Of course, the framework can also be executed in the traditional way. directly by code (most stable way so far):
sudo git clone https://github.com/s4dhul4bs/vimana-framework.git
cd vimana-framework
pip3 install -r requirements.txt
python3 vimana.py
Example of running a siddhi (vimana module):
sudo docker run -it vimana_framework:alpha run –module dmt –target-list 192.168.1.101,192.168.1.212,mypythonapp.com –port-list 5000,5001,8000 –verbose –debug –random –threads 5
Explaining the command line syntax above:
run Command to run a siddhi (vimana framework module) in inline mode (in this case, module DMT, Django Misconfiguration Tracker)
--target-list The framework supports several types of scope definition arguments (although this also depends on the arguments expected by each module). In this case, a list of IPs and URLs was used with the argument target-list (comma-separated).
--port-list Here, as with the definition of targets, the ports also accept various formats, in this case the port-list with a list of ports to be tested is being used. An important note, when you do not want the defined port to be tested before the chosen module is invoked, the --ignore-state argument must be passed so that the state of the port will not be checked.
--verbose Enable verbose mode in realtime issues presentation
--debug Enable Vimana debug mode,showing realtime technical information about execution
--random Enable randomize, this flag, enable randomization in supported modules (for example user-agent, cookies, tokens, etc)
--threads Configures the number of threads to be executed by the modules involved in the analysis (those that support threads).
To know the arguments supported by a siddhi, use the syntax: vimana.py args --module <module_name>
*Note: Vimana is a command line tool that does all the representation of the results and interaction through the terminal, so it is important to configure the buffer size to allow the correct presentation. In Terminator this can be done by editing the ~/.config/terminator/config file and adding the following entry below the [profile] section: scrollback_infinite = True
About This Version
Most of the features have been exhaustively tested for a long time against different scenarios and observed carefully, however, the tool has acquired a considerable size and complexity and therefore, there will certainly be some bugs not known at the moment. The known ones will be documented in issues. Feel free to contact us if you have suggestions, collaborations, or anything else related.
Another point about this alpha version is that the main features (siddhis) are focused on Django framework with application running in the vast majority in homologation and/or production scenarios with DEBUG true.
For the next releases
In addition to the general improvements in the entire framework structure and in the siddhis already available, there are other important points that are:
- Features for tracking and fingerprinting template engines (like Genshi, Jinja, Mako, etc.)
- Resources for automated SSTI tests (Server Side Template Injection)
- New fuzzers rules for Django
- Some lib exploits
- Rules support (semgrep-rules and others)
- Proxy support (SOCKS, CONNECT, etc
- Resources to generate custom payloads on app context
- New siddhis focused on other development frameworks such as Flask, Web2py, Bottle and so on)
- App Crawler
- DB integration
- Logging
- Siddhis to test service according with leak contexts (abduct)
Vimana Is Not
Vimana is not a vulnerability scanner, at least non-traditional, because it does not look directly for flaws like SQLi, XSS, XXE, RFI and so on. Instead, the main focus of the framework, which is also its main feature, is to perform fuzzing to trigger exceptions and from there feed other modules that can perform other tasks from that initial input. However, when I spoke about the research that led to this tool, I showed that in some cases it was possible to identify traditional vulnerabilities (such as those in the OWASP Top 10) by analyzing an exception that was triggered. So, there are already plans for a siddhi to identify these vulnerabilities, however, it is important to keep in mind that vimana is not intended to be a tool to exploit a possible sqli injection, for this it has sqlmap and several others.
There are certain parts where scope definitions are made (against which a particular module will be executed), where basic tests are made to check the state of the port informed as an argument on the command line. However, it is also important to note that this tool is not intended to be a port and service scanner, for this there is nmap and others.
And so on, what this framework is I don’t know yet, it’s early, but I can already point out some things that it is not and does not intend to be.
Use cases
Scope settings
The framework supports some options for configuring the scope against which the chosen siddhi will run. Below are the main options.
Before that, a note: Vimana is not a portscanner, so the best option, especially when the number of targets is very large, is always to scan with nmap by exporting the result to XML, which will be passed as an argument for Vimana via the –nmap-xml <nmap_results.xml> option:
python3 vimana.py run --module dmt --nmap-xml scan_result.xml
An example of nmap’s XML scope configuration is shown below, in the item Multi-Target(--nmap-xml option)One-Shot-Target (--target option)
Well, imagine that you are conducting an intrusion test and in the midst of all the uproar you end up finding a target in which no vulnerabilities were pointed out, but even so, as a good sniper, it left you a little smell[ing?] a rat.
Suppose it is an internal analysis and the IP is 192.168.0.102 and that, in addition to the known service ports, port 8000 active on that IP has also been identified. In the case of the internal testing context, the pentester will already have some information regarding the technologies used by the developers and this will allow you to infer which siddhis can be used against the target.
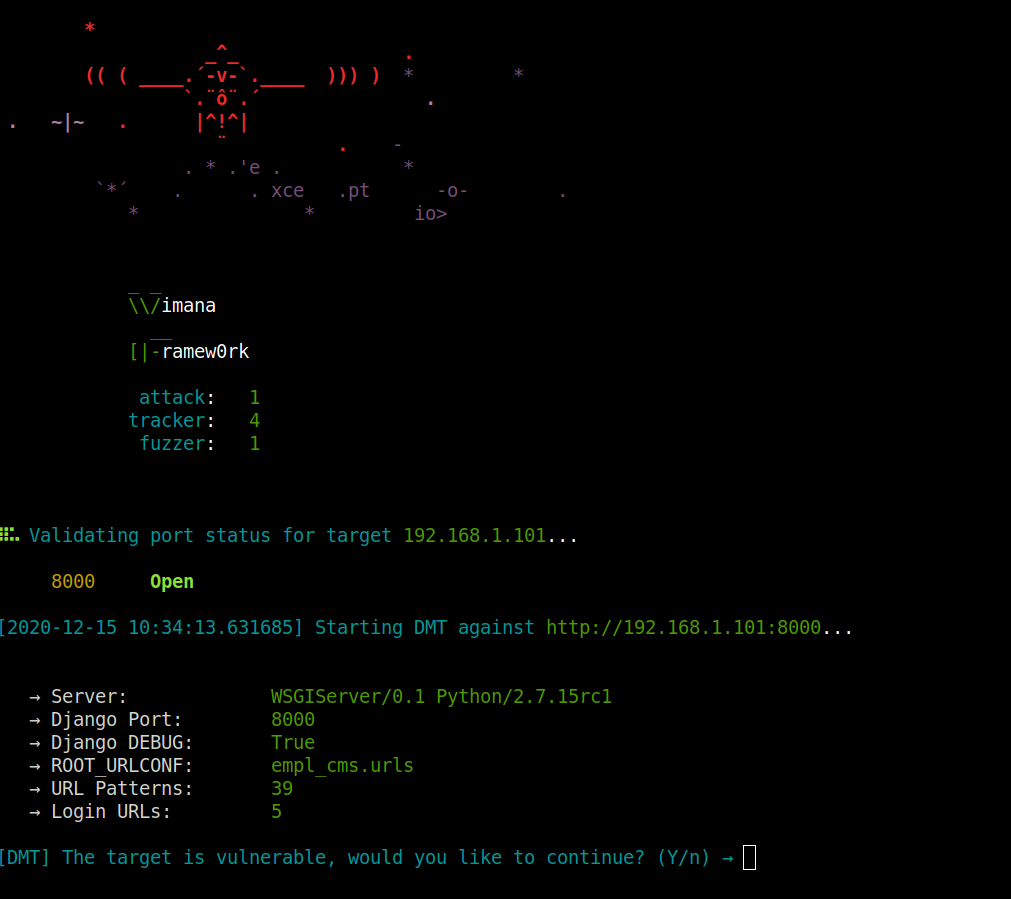
So we already know the IP in advance and also that the port we want to evaluate is active, we can then run Vimana as follows:
python3 vimana.py run --module dmt --target 192.168.0.102 --port 8000 --verbose --debug
If there is nothing that can be done by the siddhi, an informational message about it will be displayed. If any, the initial panel will be presented with some information about the target, as below:
Multi-Target (--target-list option)
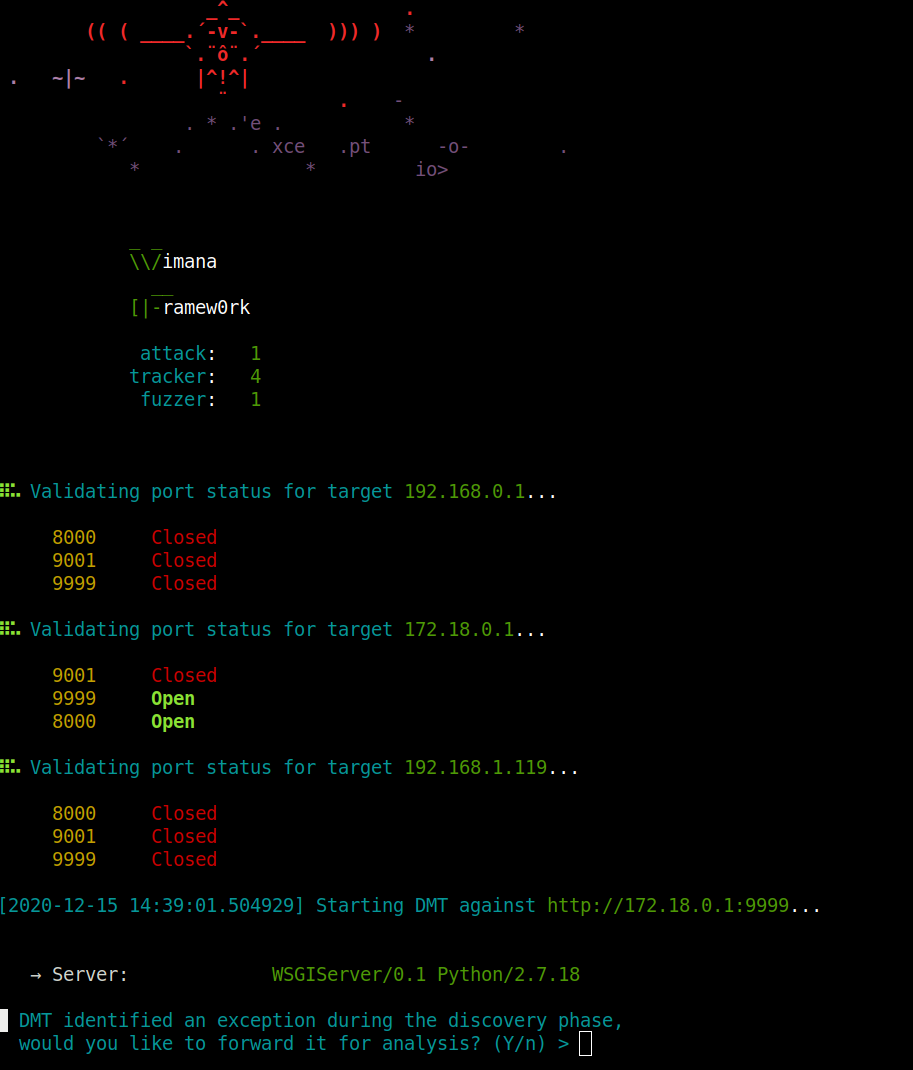
In another scenario, you have some IPs and ports to check:
python3 vimana.py run --module dmt --target-list 192.168.0.1,172.18.0.1,192.168.1.119 --port-list 8000,9999,9001
Multi-Target (--nmap-xml option)
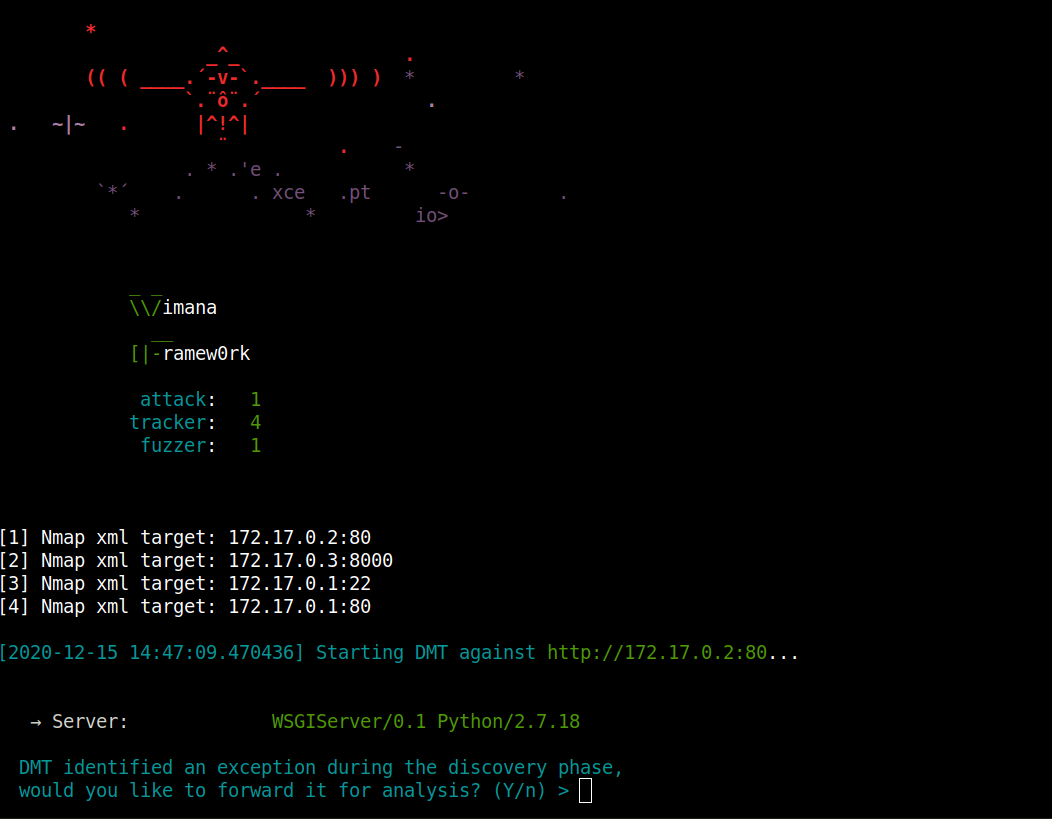
Now imagine a scenario where you have entire ranges to analyze and you don’t know the hosts ups or the open ports in each one beforehand. In this case, the best approach is to perform a scan with nmap and pass only the result in XML to Vimana. This point is important, because as already mentioned in the repository, it is important to know where each tool comes in and Vimana does not intend to be a port or vulnerability scanner, so whenever the scope is undefined and there are integer ranges for sweeping, this is always the best option:
python3 vimana.py run --module dmt --nmap-xml nmap_results.xml
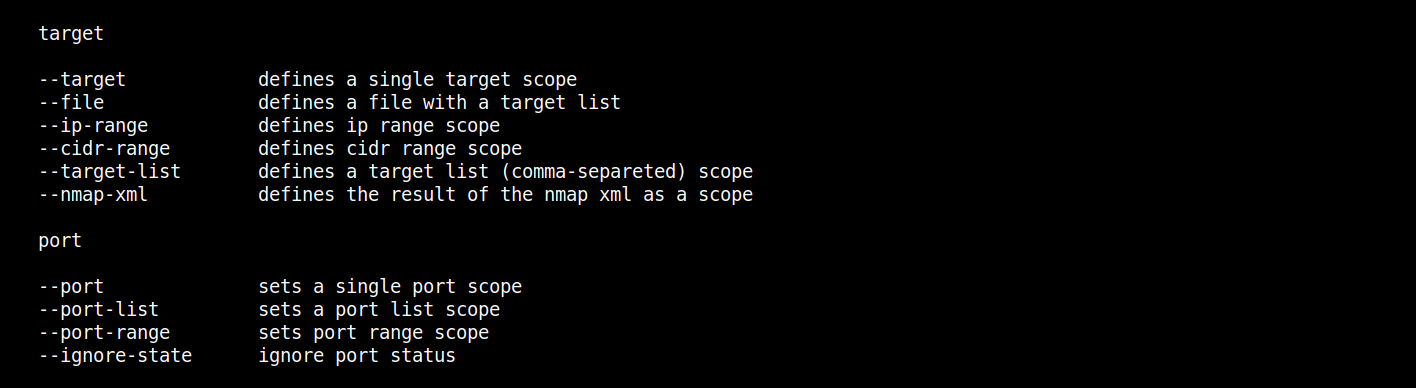
Other scoping options In addition to the above options, vimana also supports other options for scoping:
Analyzing a Django Application
Before demonstrating a use case focused on Django applications, it is necessary to be very clear from which perspective this tool was developed and what its possibilities are.
From a developer’s perspective, an exception, a warning, any error is an obstacle to be overcome in order for your application to rise and run with stability. However, from an attacker’s perspective, a rupture event, with or without error messages (as in the case of a SQLi Error Based and a Blind, XXE, SSTI, and so on) is always something to be investigated better. This is because over time it is learned that many Hanging Fruits arise from the investigation of these scenarios, which can often allow the target to be completely compromised.
One of the first steps of an intrusion test is the fingerprint of the active infrastructure, application, technologies, services and ports. Thus, the discovery stage is crucial, especially in a blackbox approach.
One of the tests performed in this step is the enumeration of directories, endpoints and URLs of the application. A characteristic of this type of test is the high number of requests that the tools need to send to the server in order to analyze the response for each attempt in order to identify or at least infer whether a particular directory / URL exists.
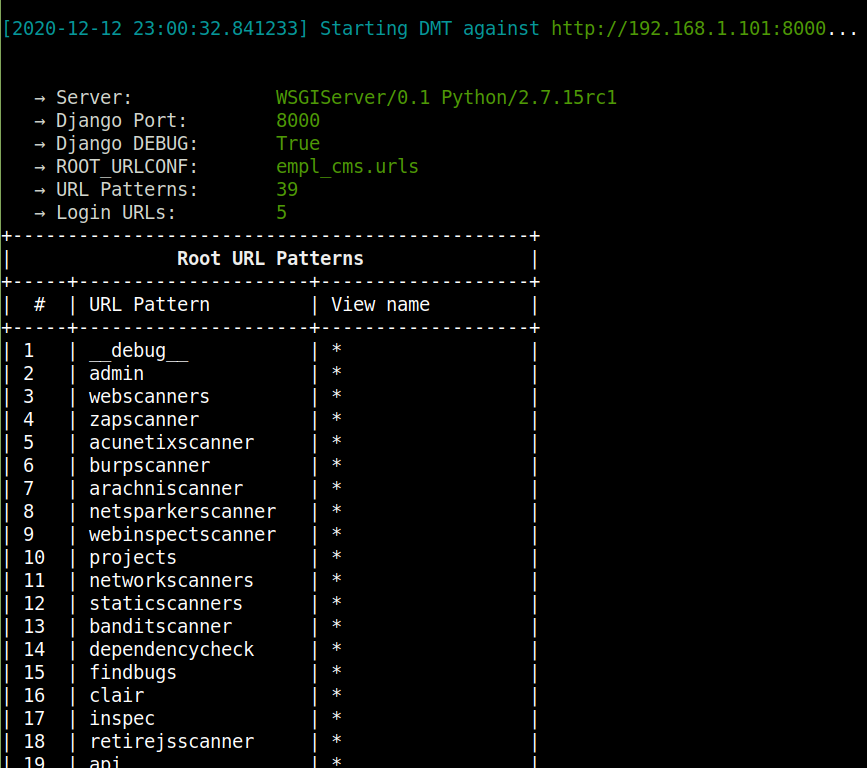
In the present context, in a Django application with DEBUG true, a plugin such as DMT (Django Misconfiguration Tracker) identifies with a single request which are the root URL Patterns of the application:
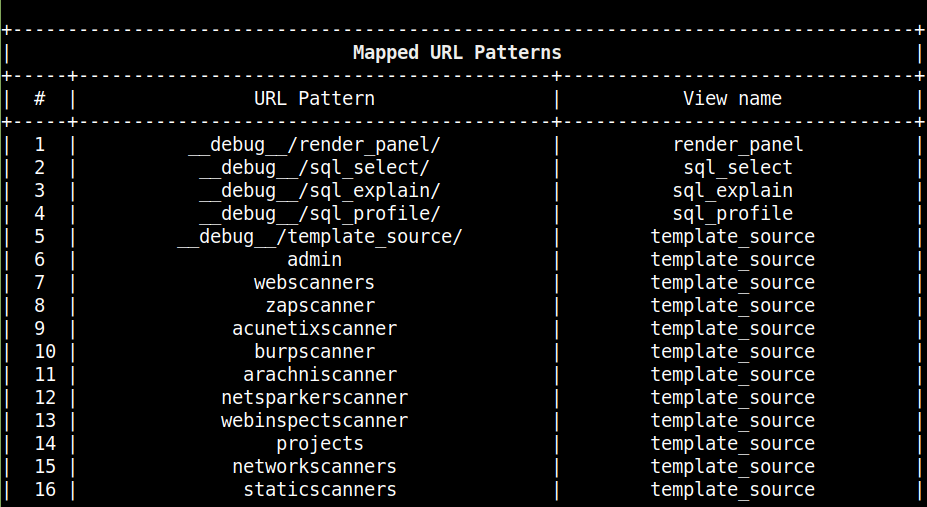
And from there it performs the mapping through NoReverseMatch and “expanding” these initial patterns to identify new URLs and data input endpoints under user control.
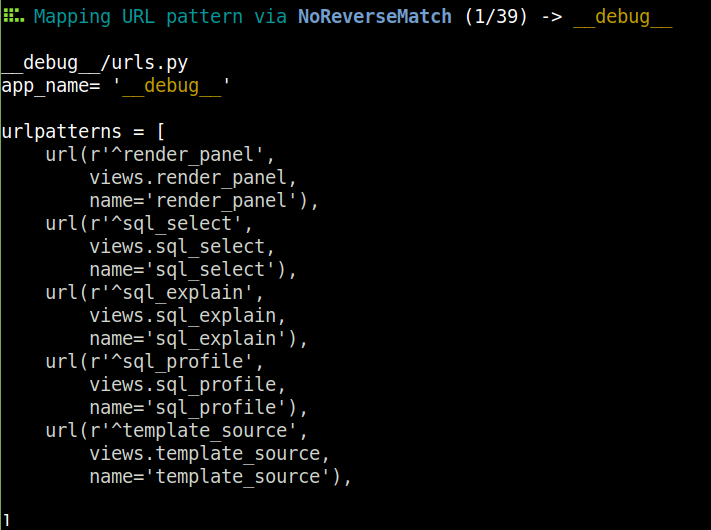
In this step, if the vimana module was executed with the debug option, some extra information is presented during the analysis, as in the case below where djmimic tries to reproduce the urls.py file for each identified application:
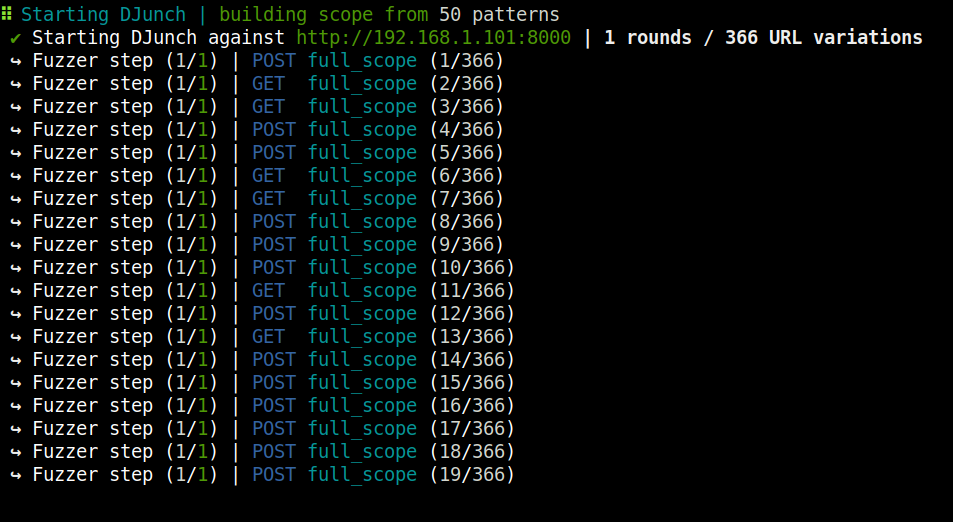
After this mapping, the DMT then invokes the application fuzzer, DJunch scoping the URLs initially identified. From this, the fuzzer will create a new scope with data of random types performing random tests alternating data types, directories, files and headers to identify exceptions:
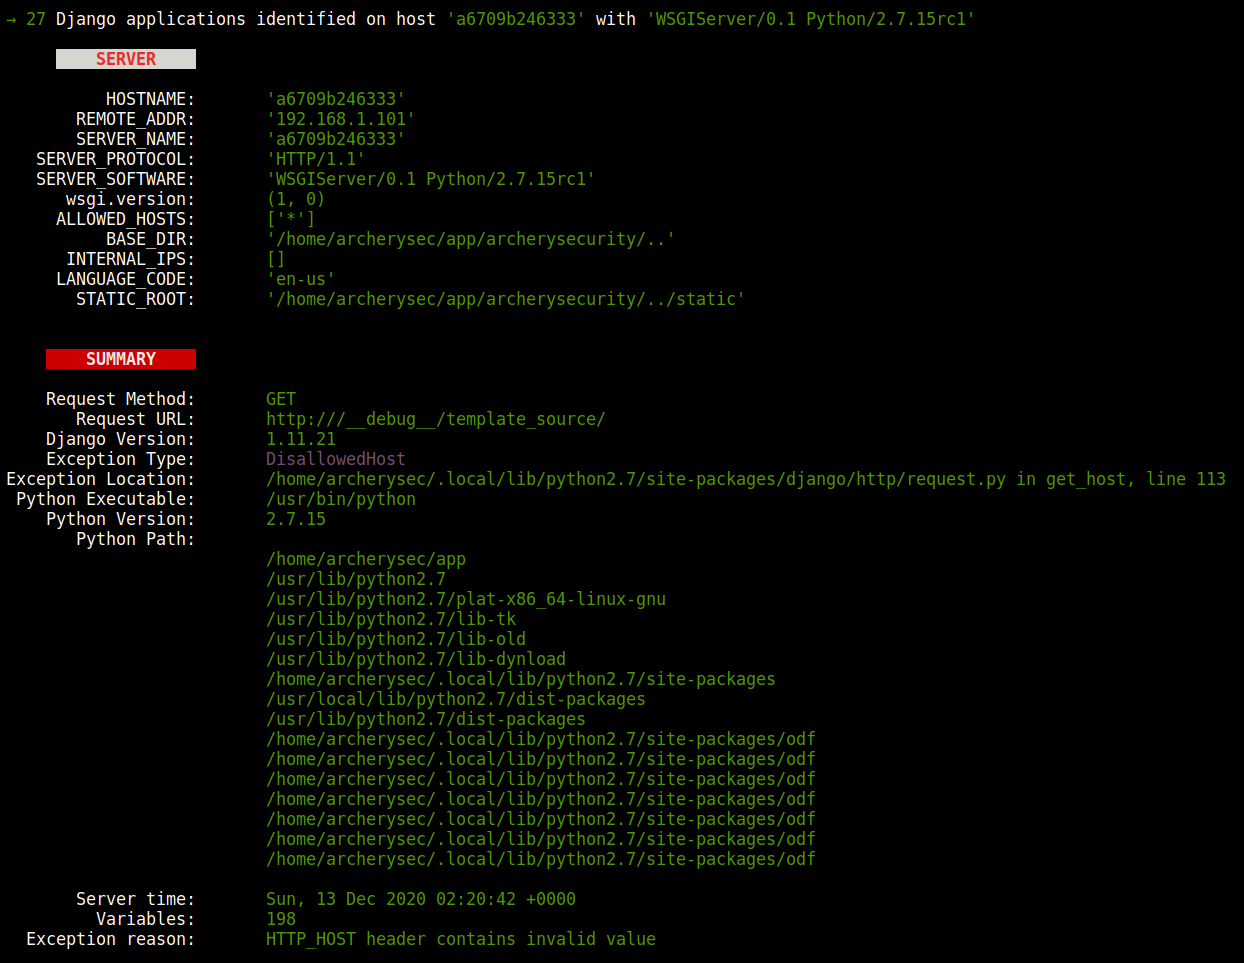
Example of an exception identified by DJunch:
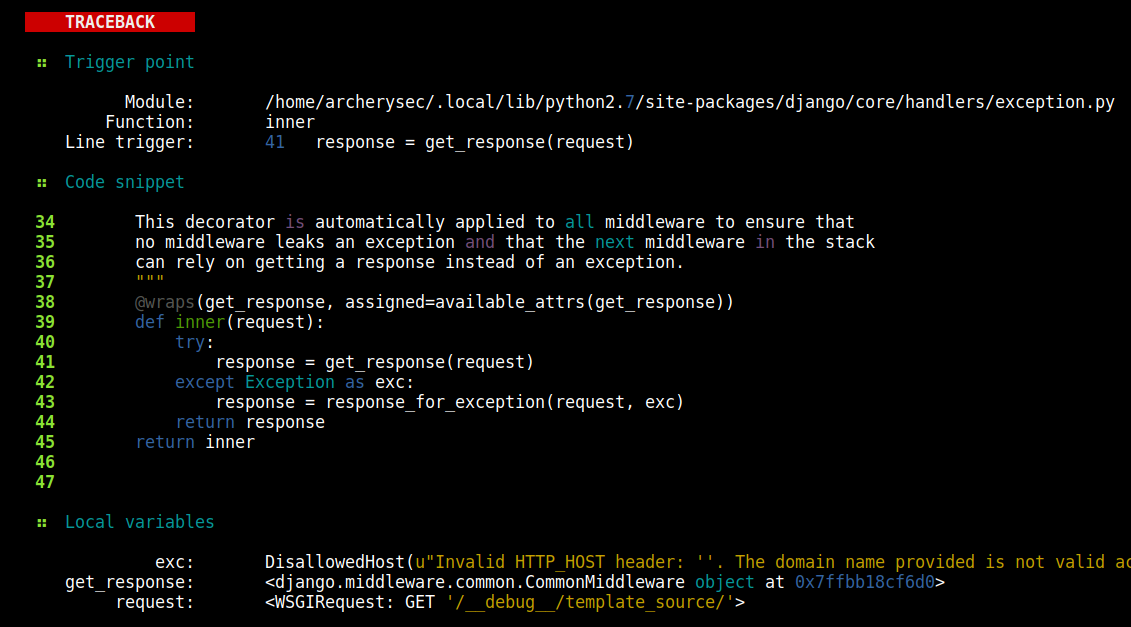
In addition, the code snippets for each module involved in the traceback are reassembled for further analysis with identification of the triggers of each module and the objects and local variables, in some cases. Once these sections are loaded in the tool, manual and SAST code review can be performed (in future releases), in addition to the identification of vulnerable modules and libraries and mapping of the application logic:
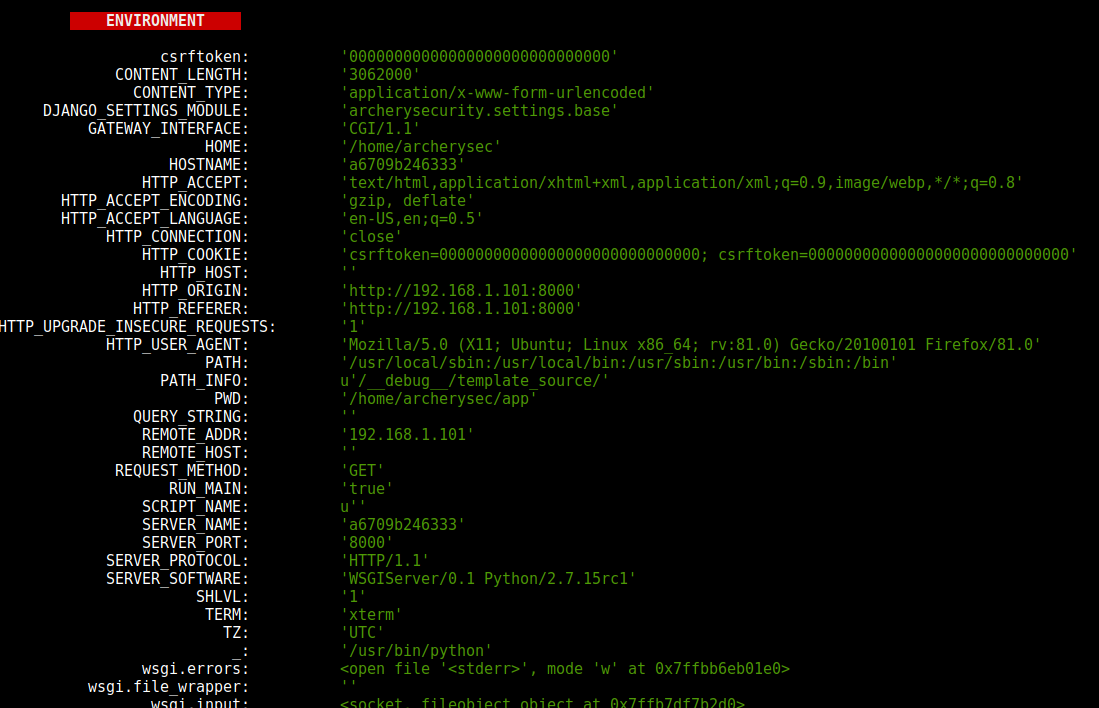
The last section of the presentation of a real-time exception is the Django application environment, the collections made in these fields and in the source code, can contain a lot of important information such as hardcoded passwords in the code, plain text passwords in environment variables, tokens , api keys, usernames, IPs, emails, URL hooks and so on. This information will later be analyzed and correlated by the abduct command (still under development), which will be responsible for crossing the information of an analysis and providing a scenario with possible attack vectors:


.png "LAZYPARIAH : A Tool For Generating Reverse Shell Payloads On The Fly")
