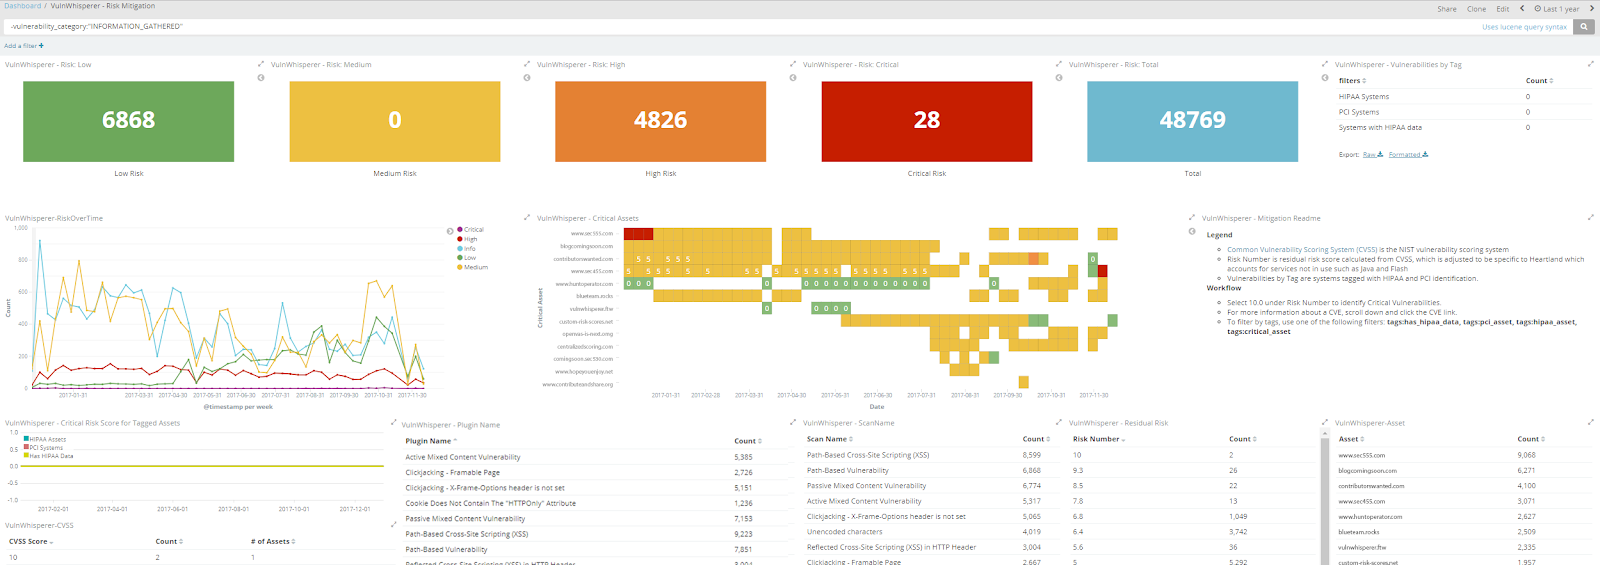
VulnWhisperer is a vulnerability management tool and report aggregator. VulnWhisperer will pull all the reports from the different Vulnerability scanners and create a file with a unique filename for each one, using that data later to sync with Jira and feed Logstash.

Jira does a closed cycle full Sync with the data provided by the Scanners, while Logstash indexes and tags all of the information inside the report (see logstash files at /resources/elk6/pipeline/).
Data is then shipped to ElasticSearch to be indexed, and ends up in a visual and searchable format in Kibana with already defined dashboards.
Also Read – Git Hound – Find Exposed Keys Across GitHub Using Code Search Keywords
- Nessus (v6/v7/v8)
- Qualys Web Applications
- Qualys Vulnerability Management
- OpenVAS (v7/v8/v9)
- Tenable.io
- Detectify
- Nexpose
- Insight VM
- NMAP
- Burp Suite
- OWASP ZAP
- More to come
- Follow the install requirements
- Fill out the section you want to process in frameworks_example.ini file
- [JIRA] If using Jira, fill Jira config in the config file mentioned above.
- [ELK] Modify the IP settings in the Logstash files to accommodate your environment and import them to your logstash conf directory (default is /etc/logstash/conf.d/)
- [ELK] Import the Kibana visualizations
- Run Vulnwhisperer
Need assistance or just want to chat? Join our slack channel
- Python 2.7
- Vulnerability Scanner
- Reporting System: Jira / ElasticStack 6.6
Install Requirements-VulnWhisperer
Install OS packages requirement dependencies (Debian-based distros, CentOS don’t need it)
sudo apt-get install zlib1g-dev libxml2-dev libxslt1-dev
(Optional) Use a python virtualenv to not mess with host python libraries
virtualenv venv (will create the python 2.7 virtualenv) source venv/bin/activate (start the virtualenv, now pip will run there and should install libraries without sudo)
deactivate (for quitting the virtualenv once you are done)
Install python libraries requirements
pip install -r /path/to/VulnWhisperer/requirements.txt
cd /path/to/VulnWhisperer
python setup.py install
(Optional) If using a proxy, add proxy URL as environment variable to PATH
export HTTP_PROXY=http://example.com:8080
export HTTPS_PROXY=http://example.com:8080
Now you’re ready to pull down scans. (see run section)
There are a few configuration steps to setting up VulnWhisperer:
- Configure Ini file
- Setup Logstash File
- Import ElasticSearch Templates
- Import Kibana Dashboards

Run
To run, fill out the configuration file with your vulnerability scanner settings. Then you can execute from the command line.
(optional flag: -F -> provides “Fancy” log colouring, good for comprehension when manually executing VulnWhisperer) vuln_whisperer -c configs/frameworks_example.ini -s nessus
or
vuln_whisperer -c configs/frameworks_example.ini -s qualys

If no section is specified (e.g. -s nessus), vulnwhisperer will check on the config file for the modules that have the property enabled=true and run them sequentially.
Next you’ll need to import the visualizations into Kibana and setup your logstash config. You can either follow the sample setup instructions [here](https://github.com/HASecuritySolutions/VulnWhisperer/wiki/Sample-Guide-ELK-Deployment) or go for the `docker-compose` solution we offer.
ELK is a whole world by itself, and for newcomers to the platform, it requires basic Linux skills and usually a bit of troubleshooting until it is deployed and working as expected. As we are not able to provide support for each users ELK problems, we put together a docker-compose which includes:
- VulnWhisperer
- Logstash 6.6
- ElasticSearch 6.6
- Kibana 6.6
The docker-compose just requires specifying the paths where the VulnWhisperer data will be saved, and where the config files reside. If ran directly after git clone, with just adding the Scanner config to the VulnWhisperer config file (/resources/elk6/vulnwhisperer.ini), it will work out of the box.
It also takes care to load the Kibana Dashboards and Visualizations automatically through the API, which needs to be done manually otherwise at Kibana’s startup.
For more info about the docker-compose, check on the docker-compose wiki or the FAQ.
Our current Roadmap is as follows:
- Create a Vulnerability Standard
- Map every scanner results to the standard
- Create Scanner module guidelines for easy integration of new scanners (consistency will allow #14)
- Refactor the code to reuse functions and enable full compatibility among modules
- Change Nessus CSV to JSON (Consistency and Fix #82)
- Adapt single Logstash to standard and Kibana Dashboards
- Implement Detectify Scanner
- Implement Splunk Reporting/Dashboards
On top of this, we try to focus on fixing bugs as soon as possible, which might delay the development. We also very welcome PR’s, and once we have the new standard implemented, it will be very easy to add compatibility with new scanners.
The Vulnerability Standard will initially be a new simple one level JSON with all the information that matches from the different scanners having standardized variable names, while maintaining the rest of the variables as they are.
In the future, once everything is implemented, we will evaluate moving to an existing standard like ECS or AWS Vulnerability Schema; we prioritize functionality over perfection.
Video Tutorial
Credit : Austin Taylor (@HuntOperator) & Justin Henderson (@smapper)


.png)