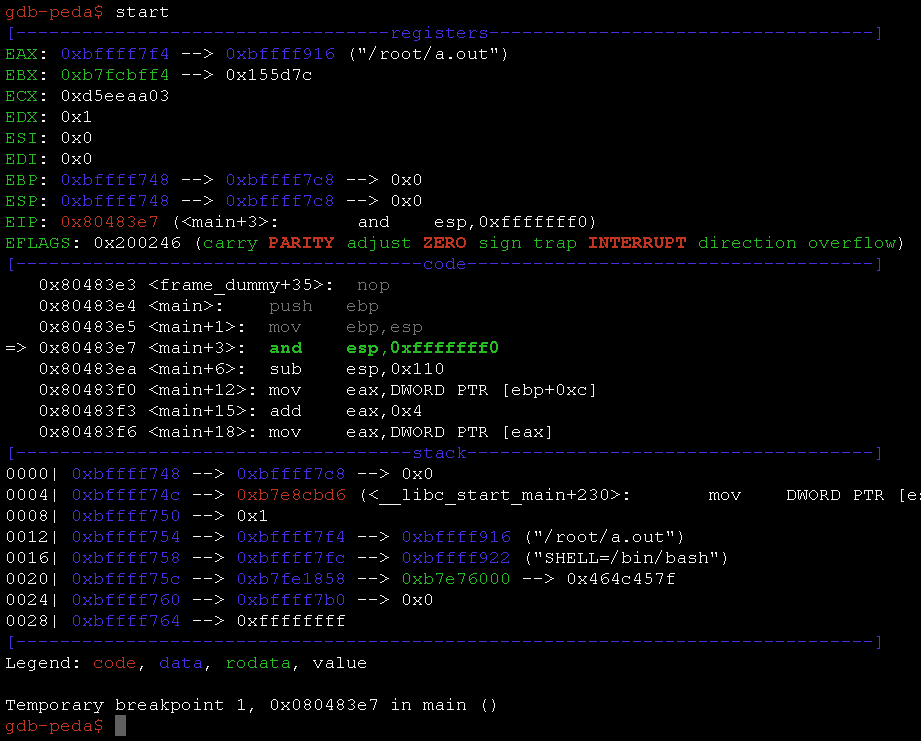
PEDA is a python exploit development assistance for GDB.
Features
- Enhance the display of gdb: colorize and display disassembly codes, registers, memory information during debugging.
- Add commands to support debugging and exploit development (for a full list of commands use
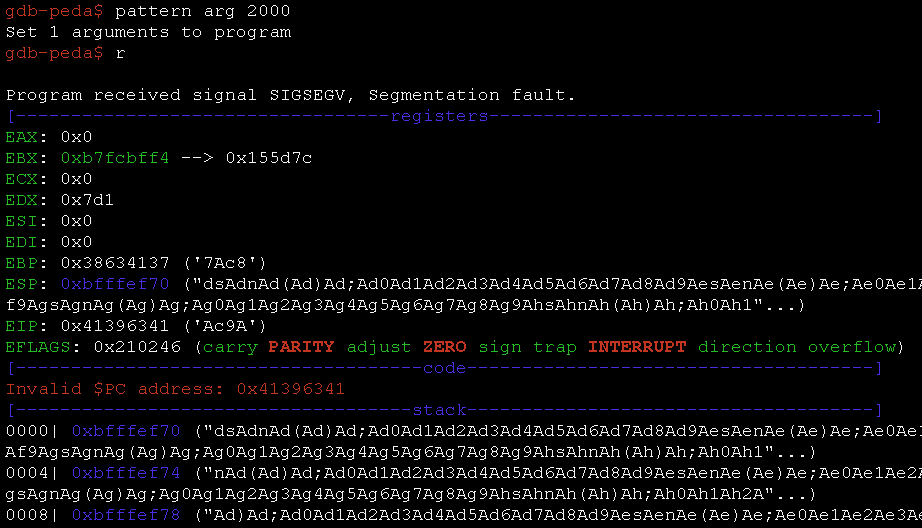
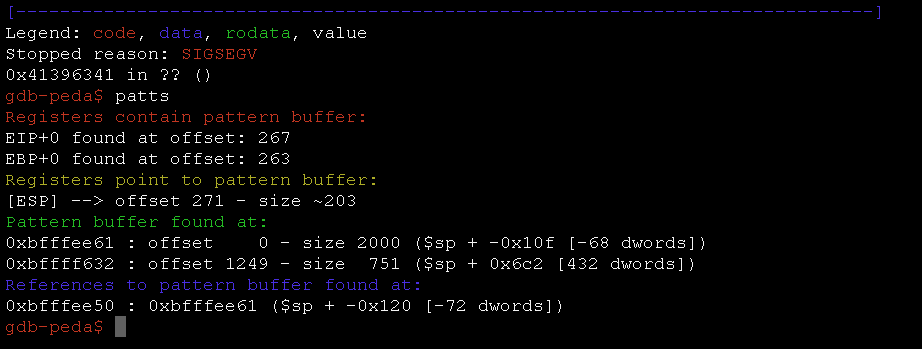
peda help):aslr— Show/set ASLR setting of GDBchecksec— Check for various security options of binarydumpargs— Display arguments passed to a function when stopped at a call instructiondumprop— Dump all ROP gadgets in specific memory rangeelfheader— Get headers information from debugged ELF fileelfsymbol— Get non-debugging symbol information from an ELF filelookup— Search for all addresses/references to addresses which belong to a memory rangepatch— Patch memory start at an address with string/hexstring/intpattern— Generate, search, or write a cyclic pattern to memoryprocinfo— Display various info from /proc/pid/pshow— Show various PEDA options and other settingspset— Set various PEDA options and other settingsreadelf— Get headers information from an ELF fileropgadget— Get common ROP gadgets of binary or libraryropsearch— Search for ROP gadgets in memorysearchmem|find— Search for a pattern in memory; support regex searchshellcode— Generate or download common shellcodes.skeleton— Generate python exploit code templatevmmap— Get virtual mapping address ranges of section(s) in debugged processxormem— XOR a memory region with a key
PEDA Installation
git clone https://github.com/longld/peda.git ~/peda
echo "source ~/peda/peda.py" >> ~/.gdbinit
echo "DONE! debug your program with gdb and enjoy"
Also Readhtrace.sh – Simple Shell Script To Debugging Http/Https Traffic Tracing
Screenshot
