Virtuailor is an IDAPython tool that reconstructs vtables for C++ code written for intel architecture, both 32bit and 64bit code and AArch64 (New!). The tool constructed from 2 parts, static and dynamic.
The first is the static part, contains the following capabilities:
- Detects indirect calls.
- Hooks the value assignment of the indirect calls using conditional breakpoints (the hook code).
The second is the dynamic part, contains the following capabilities:
- Creates vtable structures.
- Rename functions and vtables addresses.
- Add structure offset to the assembly indirect calls.
- Add xref from indirect calls to their virtual functions(multiple xrefs).
- For AArch64- tries to fix undefined vtables and related virtual functions (support for firmware).
Also Read – LinPwn : Interactive Post Exploitation Tool
- By default Virtuailor will look for virtual calls in ALL the addresses in the code. If you want to limit the code only for specific address range, no problem, just edit the Main file to add the range you want to target in the variables start_addr_range and end_addr_range:
if __name__ == ‘__main__‘:
start_addr_range = idc.MinEA() # You can change the virtual calls address range
end_addr_range = idc.MaxEA()
add_bp_to_virtual_calls(start_addr_range, end_addr_range)
- Optional, (but extremely recommended), create a snapshot of your idb. Just press ctrl+shift+t and create a snapshot.
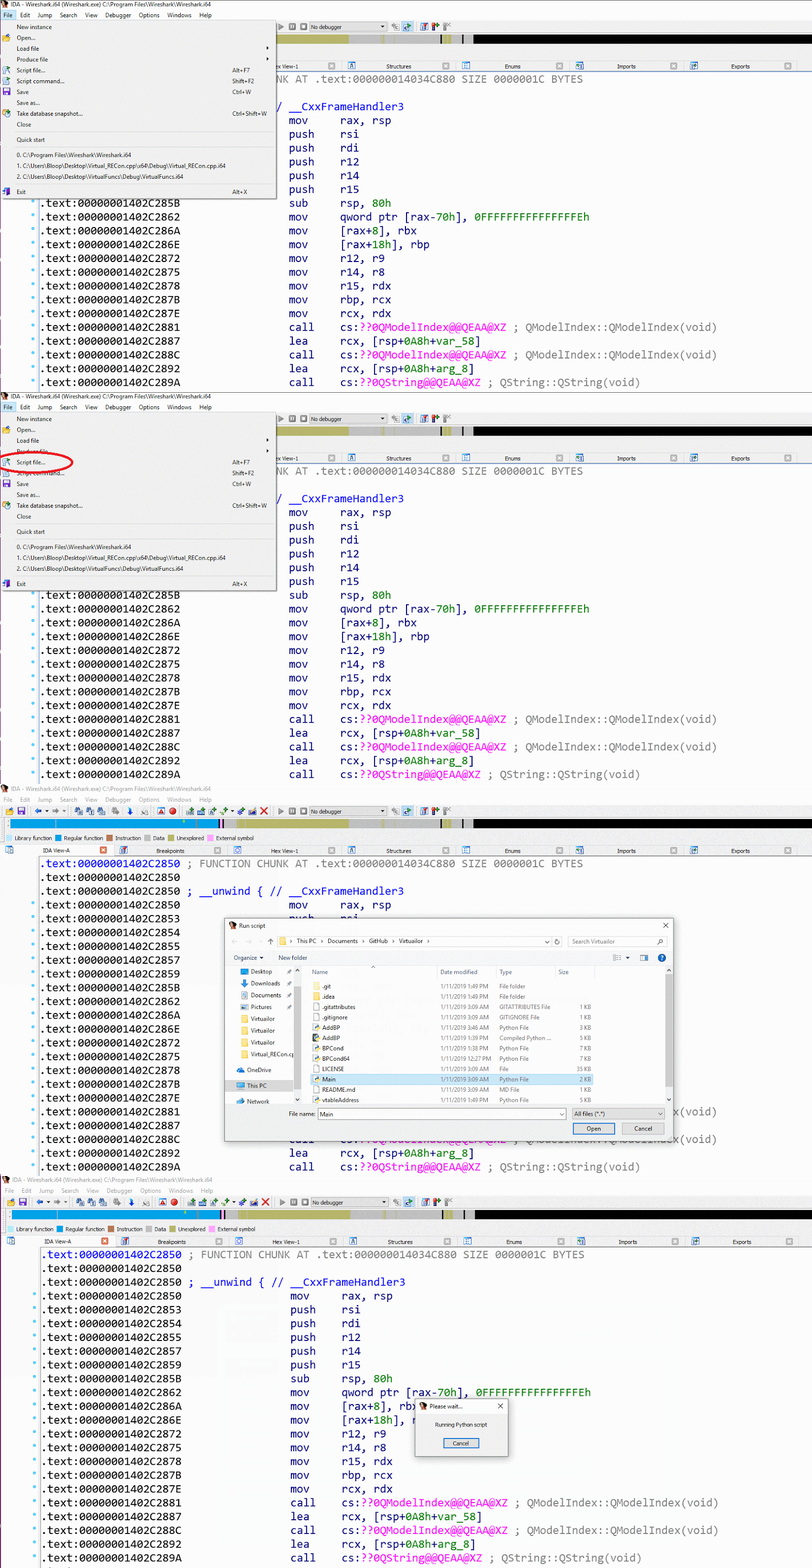
- Press File->Run script… then go to Virtuailor folder and choose to run Main.py, You can see the following gif for a more clear and visual explanation.

Now the GUI will provide you an option to choose a range to target, in case you would like to target all the binary just press OK with the default values in the start and end addresses.
Afterwards the breakpoints will be placed in your code and all you have to do is to execute your code with IDA debugger, do whatever actions you want and see how the vtables is being built! For AArch64 you can setup a remote gdb server and debug using the IDA debuggger.
In case you don’t want/need the breakpoints anymore just go to the breakpoint list tab in IDA and delete the breakpoints as you like.
It is also really important for me to note that this is the second version of the tool with both 32 and 64 bit support and aarch64, probably in some cases a small amount of breakpoints will be missed, in these cases please open an issue and contact me so I will be able to improve the code and help fixing it. Thank you in advanced for that 🙂
Output & General Functions
The structures Virtuailor creates from the vtable used in virtual call that were hit. The vtable functions are extracted from the memory based on the relevant register that was used in the BP opcode.

Since I wanted to create a correlation between the structure in IDA and the vtables in the data section, the BP changes the vtable address name in the data section to the name of the structure. As you can see in the following picture:

The virtual functions names are also being changed, take aside situations where the names are not the default IDA names (functions with symbols or functions that the user changed) in those cases the function names will stay the same and will also be add to the vtable structure with their current name.
The chosen names is constructed using the following pattern:
- vtable_
- vfunc_ the rest of the name is either offset from the beginning of the Segment, this is mostly because most binaries nowadays are PIE and PIC and thus ASLR is enforced, (instead of using the full address name, which is also quite long on 64bit environments). The vtable structure also has a comment, “Was called from offset: XXXX”, this offset is the offset from the beginning of the Segment.
Adding Structures to the Assembly
After creating the vtable Virtuailor also adds a connection between the structure created and the assembly as you can see in the following images:

P.S: The structure offset used in the BP is only relevant for the last call that was made, in order to get a better understanding of all the virtual calls that were made the xref feature was added as explained in the next section
When reversing C++ statically it is not trivial to see who called who, this is because most calls are indirect calls, however after running Virtuailor every function that was called indirectly now has an xref to those locations.
The following gif shows the added Xrefs with their indirect function call:


