Vba2Graph is a tool for security researchers, who waste their time analyzing malicious Office macros. Generates a VBA call graph, with potential malicious keywords highlighted.
Allows for quick analysis of malicous macros, and easy understanding of the execution flow.
Vba2Graph Features
- Keyword highlighting
- VBA Properties support
- External function declarion support
- Tricky macros with “_Change” execution triggers
- Fancy color schemes!
Pros
- Pretty fast
- Works well on most malicious macros observed in the wild
Cons
- Static (dynamicaly resolved calls would not be recognized)
Also ReadBabySploit – Beginner Pentesting Toolkit/Framework Written in Python
Installation
Install oletools:
https://github.com/decalage2/oletools/wiki/Install
Install Python Requirements
pip2 install -r requirements.txt
Install Graphviz
Windows
Install Graphviz msi:
https://graphviz.gitlab.io/_pages/Download/Download_windows.html
Add “dot.exe” to PATH env variable or just:
set PATH=%PATH%;C:\Program Files (x86)\Graphviz2.38\bin
Mac
brew install graphviz
Ubuntu
sudo apt-get install graphviz
Arch
sudo pacman -S graphviz
Usage
usage: vba2graph.py [-h] [-o OUTPUT] [-c {0,1,2,3}] (-i INPUT | -f FILE)

optional arguments:
  -h, --help            show this help message and exit
  -o OUTPUT, --output OUTPUT
                        output folder (default: "output")
  -c {0,1,2,3}, --colors {0,1,2,3}
                        color scheme number [0, 1, 2, 3] (default: 0 - B&W)
  -i INPUT, --input INPUT
                        olevba generated file or .bas file
  -f FILE, --file FILE  Office file with macros
Usage Examples (All Platforms)
Only Python 2 is supported:
# Generate call graph directly from an Office file with macros [tnx @doomedraven]
python2 vba2graph.py -f malicious.doc -c 2

# Generate vba code using olevba then pipe it to vba2graph
olevba malicious.doc | python2 vba2graph.py -c 1

# Generate call graph from VBA code
python2 vba2graph.py -i vba_code.bas -o output_folder
Output
You’ll get 4 folders in your output folder:
- png: the actual graph image you are looking for
- svg: same graph image, just in vector graphics
- dot: the dot file which was used to create the graph image
- bas: the VBA functions code that was recognized by the script (for debugging)
Examples
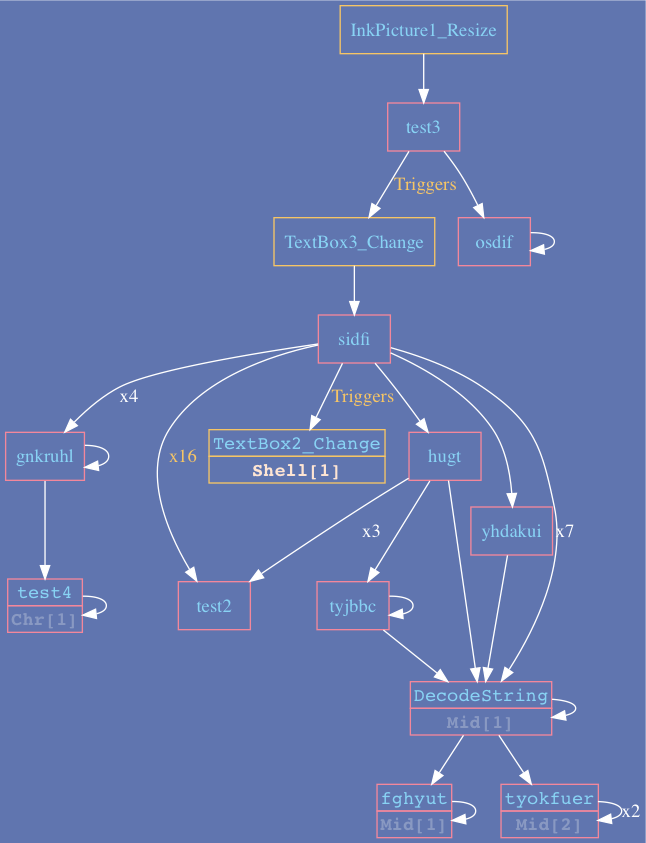
Example 1:
Trickbot downloader – utilizes object Resize event as initial trigger, followed by TextBox_Change triggers.
Example 2:
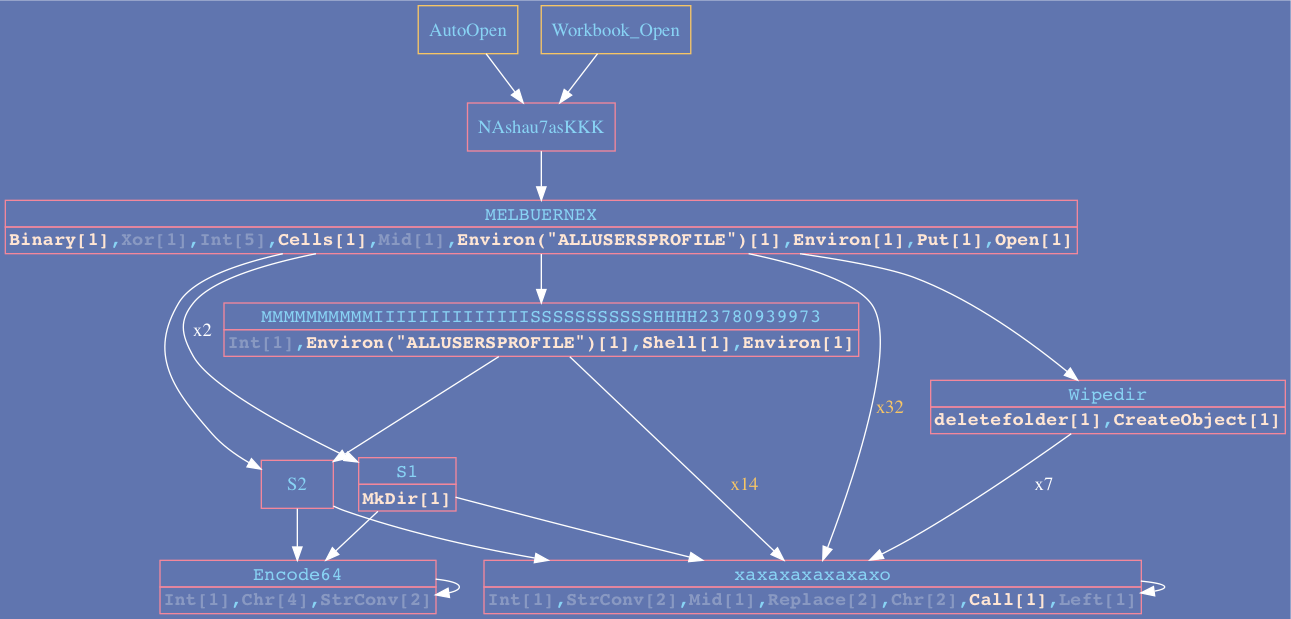
![]() Credit: @MalwareCantFly
Credit: @MalwareCantFly
You can follow us on Linkedin, Twitter, Facebook for daily Cybersecurity updates also you can take the Best Cybersecurity courses online to keep your self-updated.


")